
Profitable trading is built on consistency, and attaining it requires being able to spot recurring trends in market behavior. Price movements frequently display a repetitive character because market cycles are driven by human nature.
Therefore, a trustworthy trading method that enables traders to identify recurrent trends can give them the consistency needed to be successful in this field. The fundamentals of fractal trading are examined in this trading manual along with how it can assist traders in reliably identifying possible signals for market reversals.
Free PDF Guide : Get your Exploring the Boundless Potential of Fractal Trading Strategy
Table of Contents:
- Understanding Fractals in Trading
- Bill Williams’ Fractal Indicator
- Implementing a Fractal Trading Strategy
- The Fractal Flow Strategy
- The Fractal Scalping Strategy
- Combining Fractals with Moving Averages
- The Fractal Breakout Strategy
- Lastly
Understanding Fractals in Trading
Fractals are repetitive price movement patterns that show self-similarity over a range of periods. The Latin word “fractus,” which means fractured or fragmented, is where the word “fractal” originates.
The Mandelbrot set, which bears the name of French-American scientist of Polish descent Benoit B. Mandelbrot, is the most well-known illustration of a fractal. The Mandelbrot set has the characteristics that make it a fractal. Due to the repetitive patterns of price shifts on the stock market, it is said to be fractal. Stock values appear to follow the theory put forth by Benoit B. Mandelbrot that everything exhibits fractal nature because they move in predictable patterns over all timescales.
Bill Williams’ Fractal Indicator
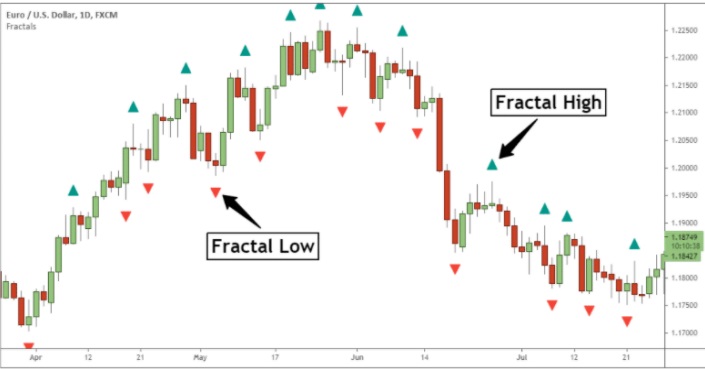
The fractal indicator was created by seasoned trader Bill Williams to help traders spot fractal trends in the market. On the price chart, this tool denotes a particular five-candlestick pattern that aids in identifying swing lows and highs.
A fractal swing high is a five-candle pattern that can be identified by an upward pointing arrow; the center candlestick contains the pattern’s highest point, while the outer two candles on either side have lower highs. The lowest point of the pattern is represented by the center candlestick, and the outer two candles on either side have higher lows.
A fractal swing low, on the other hand, is marked with a down arrow and consists of five candles. It’s important to note that, according to Williams, three bars can also create fractals. Only above or below the center candle of the five-candle price formation does the fractal arrow appear. However, because the fractal indicator’s worth depends on future prices, it is a repainting indicator. Two of the five candles required by the fractal indicator to show an arrow are always in the future in relation to the current candle. Fractal analysis is used to spot sudden changes in price. While the bearish fractal pattern suggests a potential downward price reversal, the bullish design suggests a potential upward price reversal.
Implementing a Fractal Trading Strategy
The fractals trading strategy, which entails selling on up arrows and purchasing on down arrows, is fairly simple. But only the opening of the sixth candle or the third candle after the arrow can initiate these buy and sell signs. Although the fractal trading method can successfully predict good entries for brief price reversals, the trader is ultimately responsible for deciding how each position is handled.
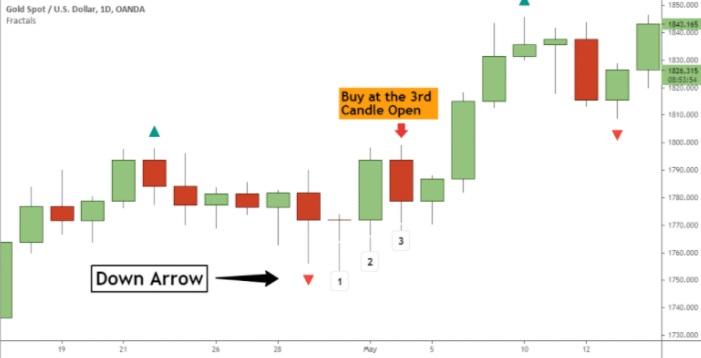
A protective stop loss should be positioned above the up arrow for sell signals and below the down arrow for purchase signals, in accordance with the fractal trading strategy. In essence, the stop loss order is placed above or below the peak or low of the middle candle. A trailing stop loss can be used by traders to lock in gains, or they can wait for the opposite fractal pattern to appear on the price chart before closing a position.
The Fractal Flow Strategy
The overall market trend, fractal patterns, and momentum divergence are all combined in the fractal flow approach. More reliable price turnaround indicators can be produced by combining momentum divergence and fractal candles. The primary goal of the fractal flow strategy is to trade in line with the current trend while using momentum divergence and fractal reversal patterns as market timing indicators. When the price movement lags behind momentum readings, momentum divergence happens.
Momentum divergence, used in conjunction with the fractal indicator, is a useful tool to validate price reversals because fractal patterns do not always result in a change in direction. One of the most popular instruments for spotting signs of momentum divergence is the RSI technical indicator. When the price action sets a new high or low but the momentum readings do not coincide with the corresponding high or low of the price action, a divergence signal is generated.
The following three requirements must be satisfied for the fractal flow approach to produce a buy signal:
- The predominant trend is bullish.
- A down arrow is printed below the price.
- An RSI bullish divergence occurs when the fractal low is formed.
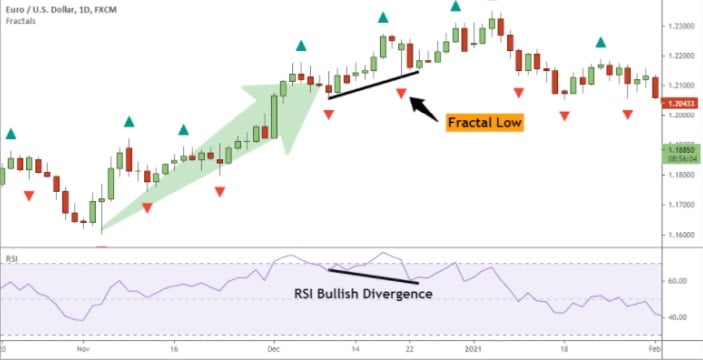
The protective stop loss order should be set up similarly to the standard fractal trading technique, below the fractal low. An up arrow is printed above the price, an RSI bullish divergence occurs when the fractal high is reached, and a sell signal is produced when the predominant trend is bearish.
The Fractal Scalping Strategy
Because it produces multiple signals throughout the day and permits traders to join and exit the market multiple times daily, the fractal indicator is also helpful for scalping. However, the fractal indicator alone produces an excessive number of trade indications, not all of which may be trustworthy.
Higher time frames typically have more reliable fractal reversal signs. Therefore, before entering a trade on intraday charts, more confluence variables are required. Traders can combine the fractal indicator with a moving average for more reliable outcomes.
Combining Fractals with Moving Averages
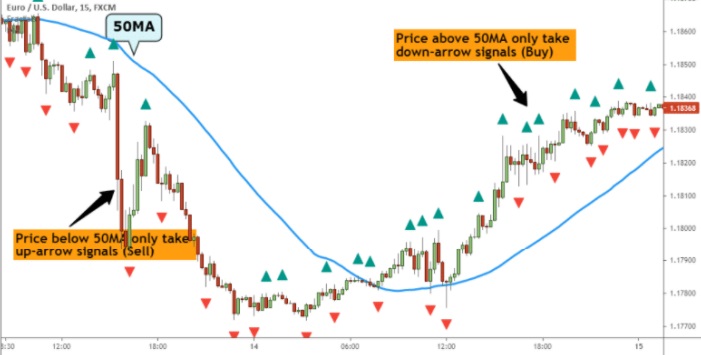
Traders combine the fractal indicator with a 50-period moving average to establish the trend path. Moving averages are simple to use in investing. A security’s price is in a rise if it is trading above the 50 moving average. On the other hand, a downtrend is indicated if the market is below the 50 moving average.
The following rules can be applied by dealers to eliminate the majority of William’s fractal signals:
- If the price is trading above the 50 moving average, only bullish fractals with a down arrow below them should be considered.
- If the price is trading below the 50 moving average, only bearish fractals with an up arrow above them should be considered.
The following chart exemplifies this strategy.
The Fractal Breakout Strategy
The fractal indicator can be used by traders to spot possible breakouts. Bill Williams, the inventor of the fractal indicator, claims that a signal to purchase is generated when the price moves above (below) the highest (lowest) point of a prior fractal. (sell). There are only three easy steps in the fractal escape strategy:
- Identify the level from the last significant fractal high (fractal low).
- When the price approaches this fractal again, use it to trigger an entry order.
- A buying opportunity is signaled when the price breaks above the previous up arrow, while a selling opportunity is signaled when the price breaks below the previous down arrow.
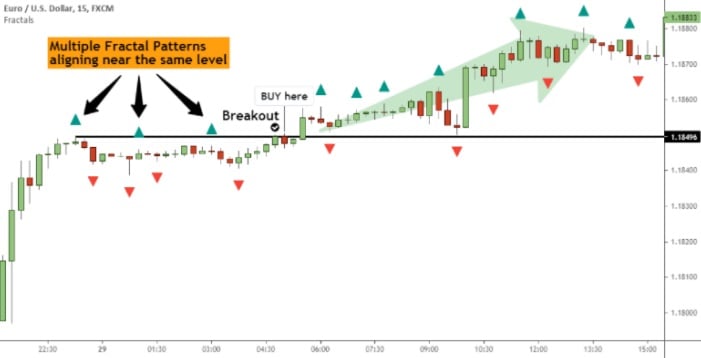
It is suggested to only act on breakout signs when the price closes above the prior fractal pattern in order to trade conservatively. One-sided price movement prior to the breakthrough may be a sign of smart money activity, which is frequently represented by large momentum candles on the chart.
These breakout signs are simple for experienced traders to identify. Multiple fractal patterns aligning at the same price point may point to a strong degree of support or resistance. In this instance, a breakthrough could lead to a more significant price change. Traders can calmly wait for numerous fractal arrows to align close to the same price level in order to increase the likelihood of breakout signals.
Lastly
This trading guide’s main takeaway is that there are several methods to use the Bill Williams fractal indicator. There is a trading method that, regardless of your personal trading preferences, can be used with the fractal gauge without risk.
The simplicity of the fractal design is one of its most important advantages. Although the fractal indicator can be used on its own, it frequently produces false indications. To increase its efficacy, it is therefore recommended to combine it with price action and other technical indicators.