
Having the right technique is essential for successfully using technical analysis to discover profitable entry and exit points. The most trustworthy indications among a variety of tools, including as trends and statistical tools like Bollinger bands, are support and resistance levels obtained by pivot point trading. The basics of pivot points, including calculating procedures, types, and trading strategies to increase profitability, will be covered in this essay.
Table of Contents:
- Understanding Pivot Points
- Pivot Point Trading Strategies
- Trading with Weekly Pivot Points
- Utilizing Pivot Points for Intraday Trading
- Mastery of Pivot Point Trading
Understanding Pivot Points
You must first appreciate support and resistance levels in the stock market in order to understand pivot points. These price points represent the range in which the stock often trades, and they are referred to as these levels. For instance, if a stock’s support level is $5 and its resistance level is $6, investors in the market will start buying the stock at $5 because they think it is undervalued. As a result, there is an excess of demand on the market, which drives up prices. When the security reaches $6, the buyers start selling it off and taking their winnings because the price wave has now become inflated. As a result, there is an excess of the stock on the market, and the bears seize control, driving down the price of the stock. The cycle then repeats with the pricing returning to $5. Because the stock price varies within this range, $5 and $6, respectively, serve as the stock’s support and resistance levels.
The support and resistance levels, along with the stock data from the previous day, can be used to create pivot points. Each day has its own pivot points, which are dependent on the data from the previous day, making for a new trading opportunity. The optimal entry and exit points, stop-loss, and take-profit positions for the trades are then established using these pivot points as a guide.
Pivot Point Trading Strategies
There are a number of procedures needed if you want to use pivot point methods while trading equities. You must first possess the information necessary to compute pivot points using data from the day before. Although most trading platforms and software include built-in pivot point calculators, you should still be familiar with how they operate so that you can do the calculations on your own if necessary. Additionally, you must understand how to use pivot points to trade effectively. Two popular tactics are breakout trading and bounce trading. We go into further depth about each of these processes below.
Determining pivot points
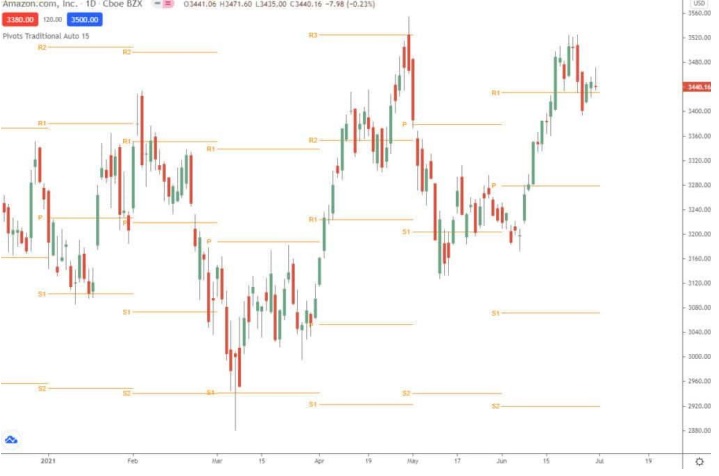
On charts, there are typically seven main pivot points used by traders. These pivot points are calculated using the previous day’s low, high, and closing prices, and each one of them represents a distinct signal. The Basic Pivot Level (PP), the middle on the chart around which all other points are centered, serves as the first pivot point. This position illustrates market equilibrium, where bullish and bearish forces are in balance. When the price moves above the PP, it shows that the bulls are in control of the market; when the price moves below the PP, it shows that the bears are in control of the market.
Additionally, based on the PP and data from the previous day, three support levels (S1, S2, and S3) and three resistance levels (R1, R2, and R3) are determined. Each of them serves as a different level and aids in determining the trade’s take-profit and stop-loss points.
The different pivot points can be calculated as follows:
Basic Pivot Level (PP) = (Previous Day’s High + Previous Day’s Low + Previous Day’s Close)/3
Resistance 1 (R1) = (2 X PP) – Previous Day’s Low
Support 1 (S1) = (2 X PP) – Previous Day’s High
Resistance 2 (R2) = PP + (Previous Day’s High – Previous Day’s Low)
Support 2 (S2) = PP – (Previous Day’s High – Previous Day’s Low)
Resistance 3 (R3) = Current Day’s High + 2 X (PP – Previous Day’s Low)
Support 3 (S3) = Current Day’s Low – 2 X (Previous Day’s High – PP)
This should produce seven parallel lines when displayed on the price chart. The PP value is used in the computation of each resistance and support level, which should be noted. As a result, the PP serves as the hub around which all other values are centered. It is crucial to utilize the correct numbers when computing the Basic Pivot Point because inaccurate PP values will also lead to incorrect other values.
Turning Point Breakout Trading Techniques:
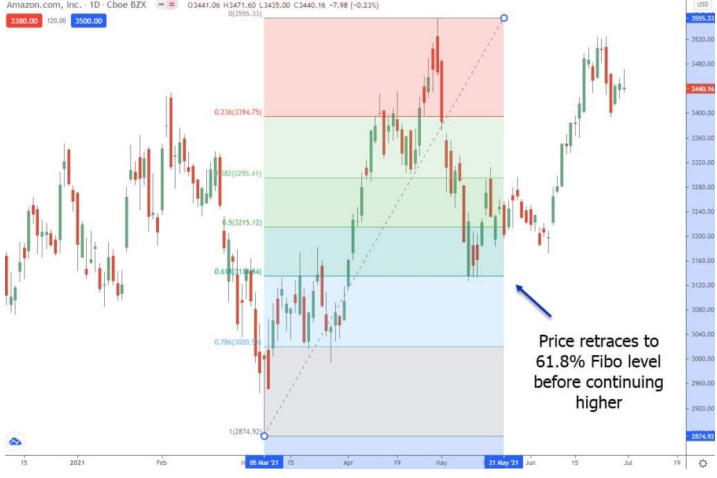
Based on a stock’s movements from the previous day, pivot points assist in determining the various levels of support and resistance. There are two potential outcomes for a stock whenever you detect it getting close to a support or resistance level. At the support/resistance level, it may either change its trend and begin traveling in the other direction, or it may break through the level and carry on moving in the same way.
If the former occurs, you ought to use the bounce approach when trading. The latter, however, requires the employment of breakout trading tactics. A strong bullish trend on the stock is indicated if a certain level, like the R1 level, is broken by the stock price. In this scenario, you ought to start a trade with a stop-loss set at a price that is close beneath the R1 price. These breakouts typically take place when the market opens in the morning because that is when activity is at its peak. It is crucial to keep in mind that each pivot transaction
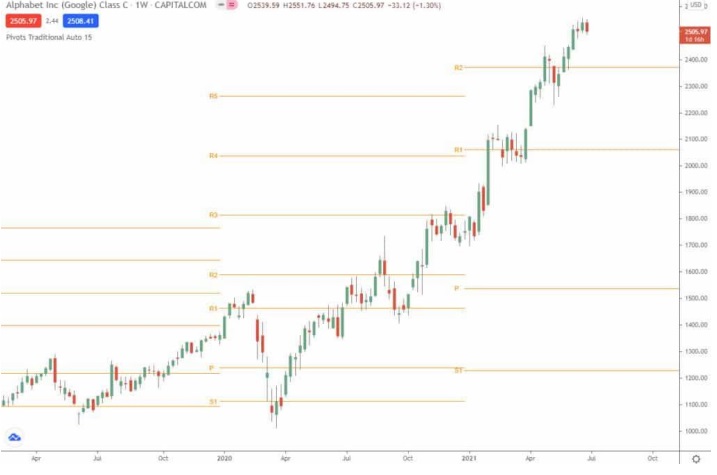
Trading with Weekly Pivot Points
The support and resistance levels in weekly pivot trading are determined using the close, high, and low prices from the prior week. The closing price on Friday serves as the week’s close price. The week runs from Monday through Friday. However, the round-the-clock forex market also makes extensive use of pivot trading tactics. When this happens, the New York markets’ closing hour may be taken into account. In other cases, the price at Friday’s 11:59 p.m., when the market closes for the weekend, may be utilized.
Although it is less typical for day traders, positions can be kept overnight and moved from one day to the next using weekly pivot points. However, numerous candles are needed to identify breakouts or bounces and set stop-losses, and the standard candle timeframe is typically 15 or 30 minutes, or at most an hour. Timeframes longer than this might not offer enough candles to make the method work properly.
Utilizing Pivot Points for Intraday Trading
The close, high, and low prices from the previous week are used to define the support and resistance levels in weekly pivot trading. The week’s closure price is determined by the Friday closing price. The start of the week is Monday and ends on Friday. But pivot trading strategies are also widely used in the 24-hour FX market. The closing hour of the New York markets may be considered when this occurs. In other circumstances, the price at the market’s weekend closing time of Friday at 11:59 p.m. may be used.
Positions can be held overnight and shifted from one day to the next using weekly pivot points, albeit it is less common for day traders. The normal candle timeframe is often 15 or 30 minutes, or at most an hour, and multiple candles are required to spot breakouts or bounces and set stop-losses. Longer time periods might not provide enough candles to make the procedure effective.
Mastery of Pivot Point Trading
There are crucial factors to keep in mind if you’re new to pivot trading in order to stop losing money and develop into a profitable trader. In order to avoid confusion, it is first important to distinguish between the PP line, support lines, and resistance lines. The lines can be color-coded, which is a common technique for quickly identifying patterns. Second, always set a stop-loss for each transaction to limit losses and maintain a defined risk-to-reward ratio. Finally, the secret to successful trading is discipline. It’s crucial to follow your guidelines and maintain discipline. Do not close a transaction until the stop-loss is reached or the next price line is touched. These characteristics are all necessary for consistently profitable trading. Trading might be a simple way to make money, but consistency is key to long-term success.