
The use of technical analysis by stock traders is crucial. In order to predict future price trends, it entails examining the price changes of stocks, commodities, and other financial instruments. The foundation of technical analysis is the notion that the market is made up of patterns, which may be utilized to forecast future price movements. Trading professionals can enter or exit transactions with greater knowledge of these patterns.
The fundamentals of technical analysis, including chart patterns, indicators, and methods, will be covered in this extensive tutorial. We will also detail exactly how to examine the stock market using technical analysis in detail. Last but not least, we provide a free PDF download that is jam-packed with knowledge regarding technical analysis for stock trading. With the aid of technical analysis, you will discover how to increase your trading earnings and decrease your losses with the help of this comprehensive book.
Technical analysis is a technique for assessing financial instruments or assets by looking at data such as historical price trends and trading activity. The idea behind this strategy is that past price changes can be predicted using historical data.
By choosing wisely when to enter and leave positions, traders can use this knowledge to develop effective trading strategies. This article gives an outline of the fundamentals of technical analysis as well as the many stock market trading approaches.
Table of Contents
- Introduction to Technical Analysis
- Technical Analysis in Stock Trading
- Comparing Technical and Fundamental Analysis
- Price Action vs Technical Analysis
- Commonly Used Technical Analysis Indicators
- Applying Technical Analysis in Stock Trading
- Analyzing Stock Trends using Technical Analysis
- Conclusion
Introduction to Technical Analysis
The study of previous price movements of an asset is known as technical analysis, and it is used to forecast future price movements. With the development of trading platforms and charting software, it is gaining popularity among novice investors. Any security with historical chart data can be subjected to technical analysis in order to manage risk. It is crucial to keep in mind that this is a short-term strategy, and the effectiveness of it depends on how the market’s players trade in concert.
It’s important to remember that there are other methods for examining equities than technical analysis. Additionally, basic analysis examines the underlying financial and economic issues that influence the value of a securities. Fundamental analysis examines a company’s financial statements, management, and industry trends among other things, whereas technical analysis focuses on price patterns. To make their trading selections, many traders combine the two strategies.
Using indicators is a key component of technical analysis. These are arithmetic computations based on a security’s price and/or volume. Moving averages, the relative strength index (RSI), and the stochastic oscillator are a few examples of indicators. Trends, overbought or oversold circumstances, and potential buy or sell signals can all be found using these indicators.
It’s crucial to keep in mind that technical analysis isn’t always reliable. There is no assurance that a forecasted price movement will actually take place because it is a speculative strategy. In addition, outside influences like market manipulation might have an impact on technical analysis. As a result, it’s critical for traders to employ sensible risk-management techniques and refrain from relying entirely on technical analysis.
Overall, technical analysis can be a helpful tool for investors and traders, but it’s crucial to recognize its limitations and combine it with other strategies. Furthermore, it’s crucial to remember that past performance is not a predictor of future performance.
Technical analysis is essentially a short-term technique, and as the time horizon gets longer, it becomes less effective. The price of a security can be reasonably predicted for the next few minutes or hours, but it gets harder to anticipate the price of a security for the following few months. It can be challenging to precisely estimate the price of an asset in the short run since short-term market manipulation and other outside factors might have an impact on short-term price changes. It is advised to combine technical and fundamental analysis for longer-term forecasts, taking into account underlying financial and economic factors that may have an impact on a security’s value over time.
Technical Analysis in Stock Trading
All of those are typical technical analysis indicators that are used to forecast stock market price changes. Here is a quick description of each:
- Price trends – This refers to the overall direction of the stock’s price over a period of time. Analysts look for patterns in the stock’s price movements, such as uptrends, downtrends, or sideways movements.
- Chart patterns – This refers to specific patterns that can be observed on a stock’s price chart, such as head and shoulders, double tops and bottoms, and triangles. These patterns can indicate potential changes in the stock’s price direction.
- Volume – This refers to the number of shares of a stock that are traded over a certain period of time. High volume can indicate strong buying or selling pressure and can be used to confirm price movements.
- RSI (Relative Strength Index) – This is a momentum indicator that compares the magnitude of recent gains to recent losses. It can be used to identify overbought or oversold conditions.
- Moving averages – This indicator is used to smooth out the stock’s price movements and can be used to identify trends. Commonly used moving averages are the 50-day moving average and the 200-day moving average.
- Support and resistance levels – These are levels on a stock’s price chart where the stock has had difficulty breaking through in the past. Support levels are where the stock’s price tends to find support and resistance levels are where the stock’s price tends to find resistance. They can be used to identify potential buy or sell signals.
It’s important to remember that technical analysis is not a precise science and is not always correct. There is no assurance that a forecasted price movement will actually take place because it is a speculative strategy. As a result, it’s critical for traders to employ sensible risk-management techniques and refrain from relying entirely on technical analysis.
Technical Analysis in Stock Trading
Comparing Technical and Fundamental Analysis
There are two primary approaches that traders use when approaching trading and investing: fundamental analysis and technical analysis. Fundamental analysis evaluates a company’s financial accounts to estimate its fair worth based on factors like sales, revenue, and net profits, in contrast to technical analysis, which focuses on looking at price charts and data points.
Although there is constant discussion about which strategy is preferable, it’s crucial to realize that both have a place in trading. Fundamental analysis is more suitable for long-term investments held over months or years, but technical analysis is more beneficial for short-term transactions or trying to time the market when entering or quitting a position.
It’s crucial to remember that both approaches have advantages and disadvantages, and proponents of either strategy may question the advantages of the other. For a more complete understanding of a stock, it’s critical to take into account the context and time period of the investment and to utilize a combination of technical and fundamental analysis.
Understanding Fundamental Analysis
Technical analysis’ quickness, which enables investors to quickly assess and profit from price swings in a company, is one of its advantages. Investors can analyze more stocks and find potential profit possibilities by using technical analysis. It’s crucial to remember that technical analysis depends on the interpretation of charts and patterns, which can be arbitrary and cause uncertainty in the analysis. Technical trading setups also have a poor success rate and need a lot of transactions in order to be lucrative.
It’s crucial to remember that technical and fundamental analysis can be utilized in conjunction with one another and are not mutually incompatible. Technical analysts can profit from price changes brought on by fundamental investors’ activities during times of crisis and ambiguity. For instance, during the Covid-19 pandemic-related market lows in March 2020, value investors were buying up shares at a discount, providing technical analysts with a chance to profit from the rise brought on by this infusion of cash.
Exploring Technical Analysis
The primary benefit of technical analysis is how quickly and effectively it can analyze equities. Technical analysts’ odds of making a good trade increase as they evaluate more companies and produce more suggestions. This is particularly helpful in the short term because stock price changes are affected by variables that fundamental research does not consider, such as market mood, psychology, supply and demand, and economic conditions. Technical analysis does, however, have some disadvantages, such as its subjectivity and the potential for ambiguity. Technical trading setups need a lot of trades to be lucrative because their success rate is so low. Despite these restrictions, it’s crucial to remember that technical and basic analysis don’t have to be used in tandem.
While fundamental analysis can offer a long-term perspective on the stock’s worth, technical analysis can be utilized to spot short-term patterns and profit from them.
Another drawback of technical analysis is that it only considers past price and volume data, ignoring potential future announcements or events that can affect the stock price. This means that technical analysis is not a guarantee of future performance and that it cannot always forecast future market movements.
It is also crucial to keep in mind that market manipulation and insider trading can have an impact on technical analysis, skewing the data and making it challenging to correctly understand the charts.
Technical analysis can be a helpful tool for traders overall, but it shouldn’t be the only way to decide which trades to make. A more complete picture of the stock and its performance can be obtained by combining technical and fundamental research with additional techniques like news and market sentiment. Additionally, it’s crucial to employ a variety of indicators and comprehend their advantages and disadvantages.
Finally, it’s critical to keep in mind that no single signal or trading method will ensure success in the stock market, and it’s crucial to constantly assess risk and exposure. Every time a trader enters the market, they should have a clear trading strategy and risk management plan in place.
Price Action vs Technical Analysis
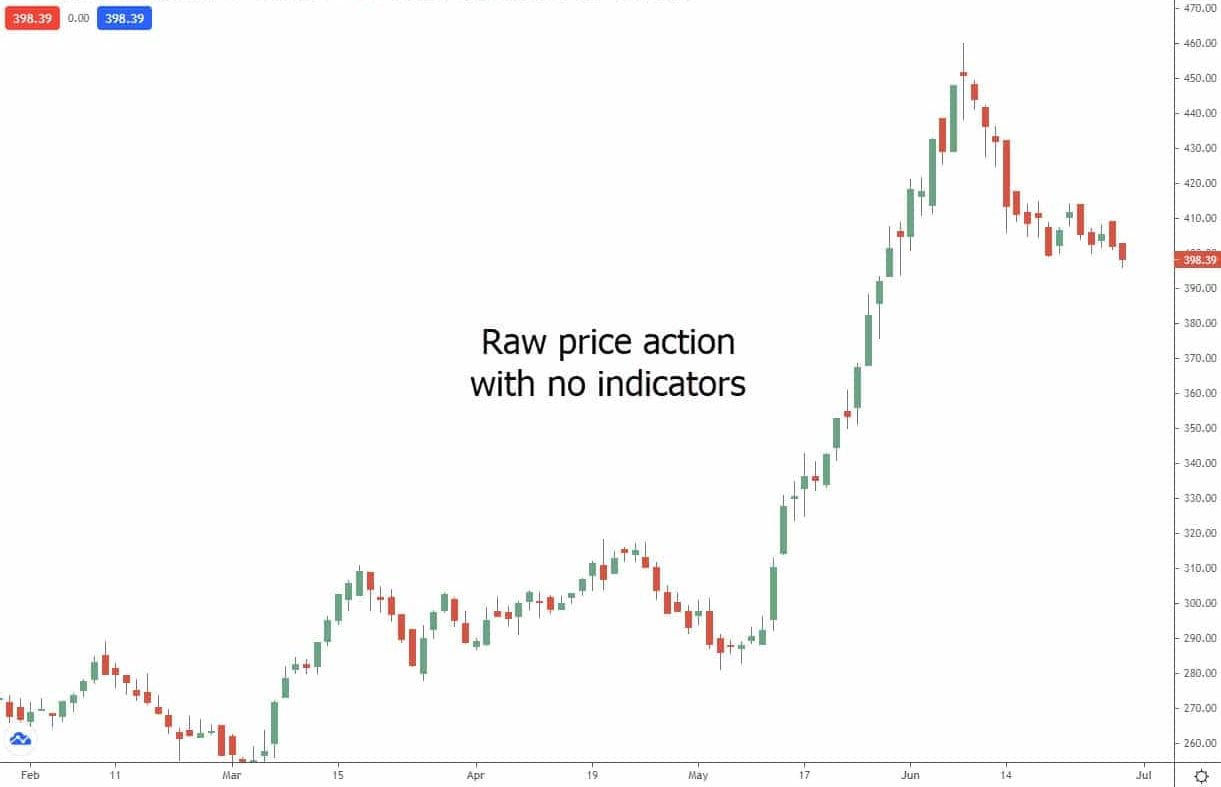
Price action, which depicts how a stock’s price changes over time, is the fundamental component of technical analysis. Price action is a key component of technical analysis because it is used to create technical indicators like moving averages and RSI. While some could contend that price action and technical analysis are synonymous, the difference is merely one of semantics. Price action must be understood in order to perform technical analysis, but the two are distinct concepts.
Price Action vs Technical Analysis
Commonly Used Technical Analysis Indicators
Here we will discuss in more depth some of the indicators we mentioned earlier in this post.
Relative Strength Index (RSI)
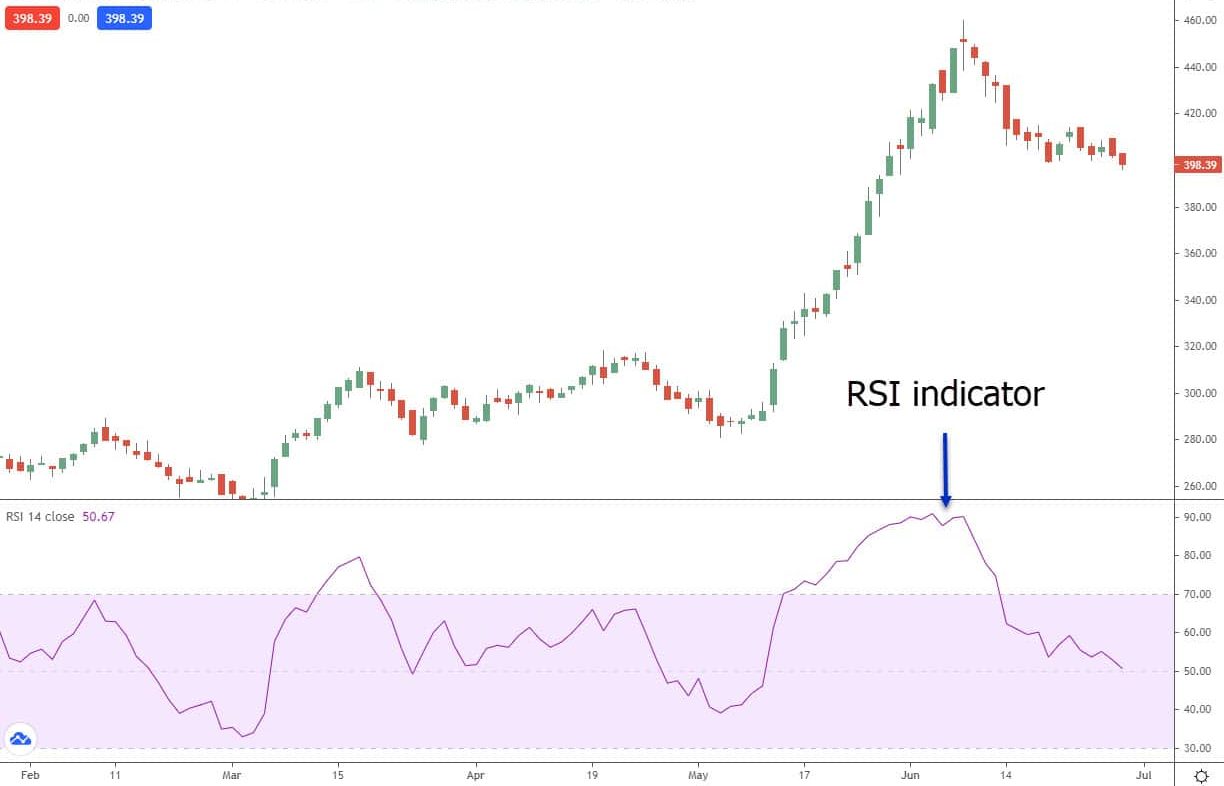
The rate of change in a stock’s price is calculated using the RSI technical indicator, which depicts the data on a scale from 0-100. With numbers below 30 indicating oversold and above 70 suggesting overbought, it aids in determining when a stock is overbought or oversold. However, it’s crucial to additionally take into account the market backdrop and the general direction of the company before making any trading decisions based on RSI.
It’s critical to remember that RSI is a lagging indicator, which means it tends to track rather than forecast market movement. As a result, to create a thorough trading strategy, it should be utilized in conjunction with other technical indicators and fundamental analysis. The probable trend reversal points can also be found using RSI. A trend may be losing strength and a potential reversal may be on the horizon when RSI values approach overbought or oversold levels. Though it should be used in conjunction with other indicators and analysis, RSI is a beneficial tool for traders overall.
Relative Strength Index (RSI)
Moving Averages
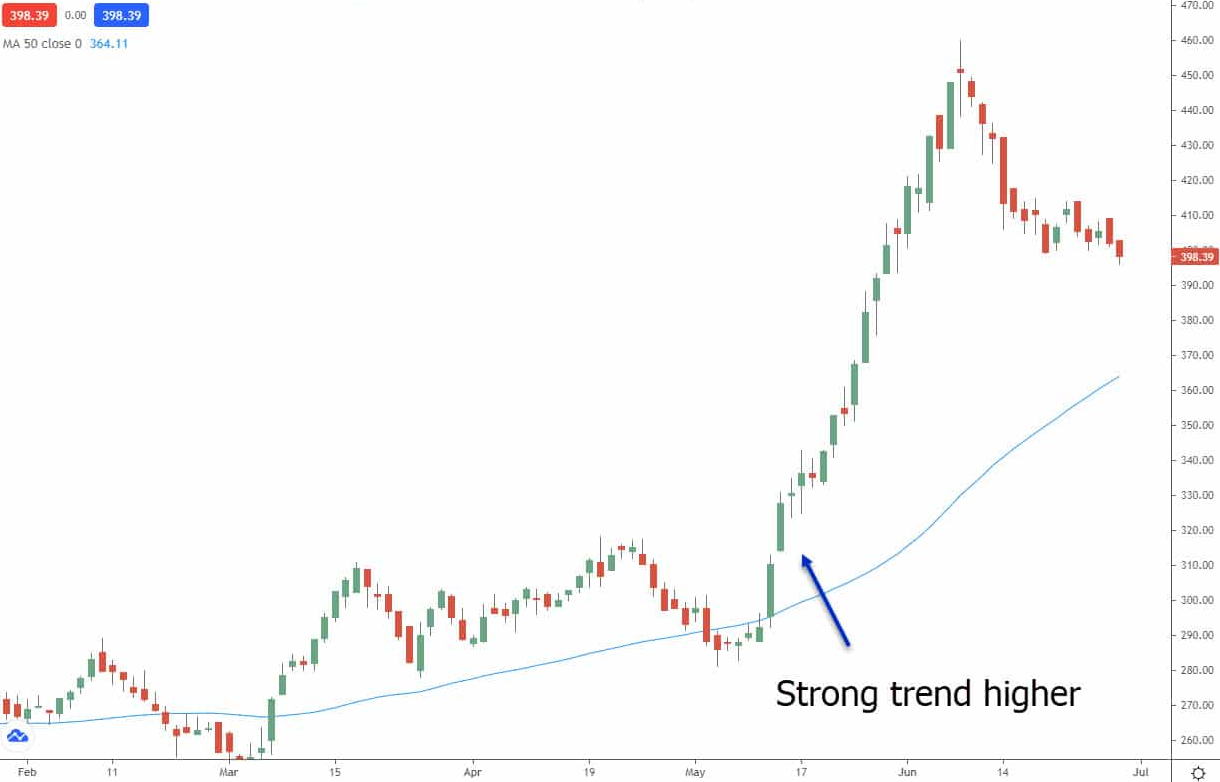
Technical analysts frequently utilize moving averages to determine the average price of a stock over a given time period. They are beneficial for deals of diverse duration because they may be changed for various time frames. These averages can be used to spot prospective trends as well as points of support and resistance. For instance, a strong degree of support at that price point and a potential bounce if the stock dips to that level may be indicated by a company’s stock trading above its 50-day moving average at the time of analysis.
On the other hand, if a stock is trading below its moving average, it can be a sign of resistance there. It’s crucial to remember that moving averages are not always respected by the market because they are based on past data and are not predictive in nature. The trader must ultimately evaluate the stock and choose how much importance to accord this signal.
When utilizing moving averages to make trading decisions, it’s crucial to take other technical indicators and fundamental analysis into account. To get a fuller picture of a stock’s performance, moving averages can also be utilized in conjunction with other indicators like RSI or MACD. Furthermore, it’s crucial to remember that volatility can influence moving averages, which means they might not always give reliable recommendations. Because of this, traders should be aware of the indicator’s limits and combine it with other indications and data to create a more effective trading strategy.
Moving Average Convergence Divergence (MACD)
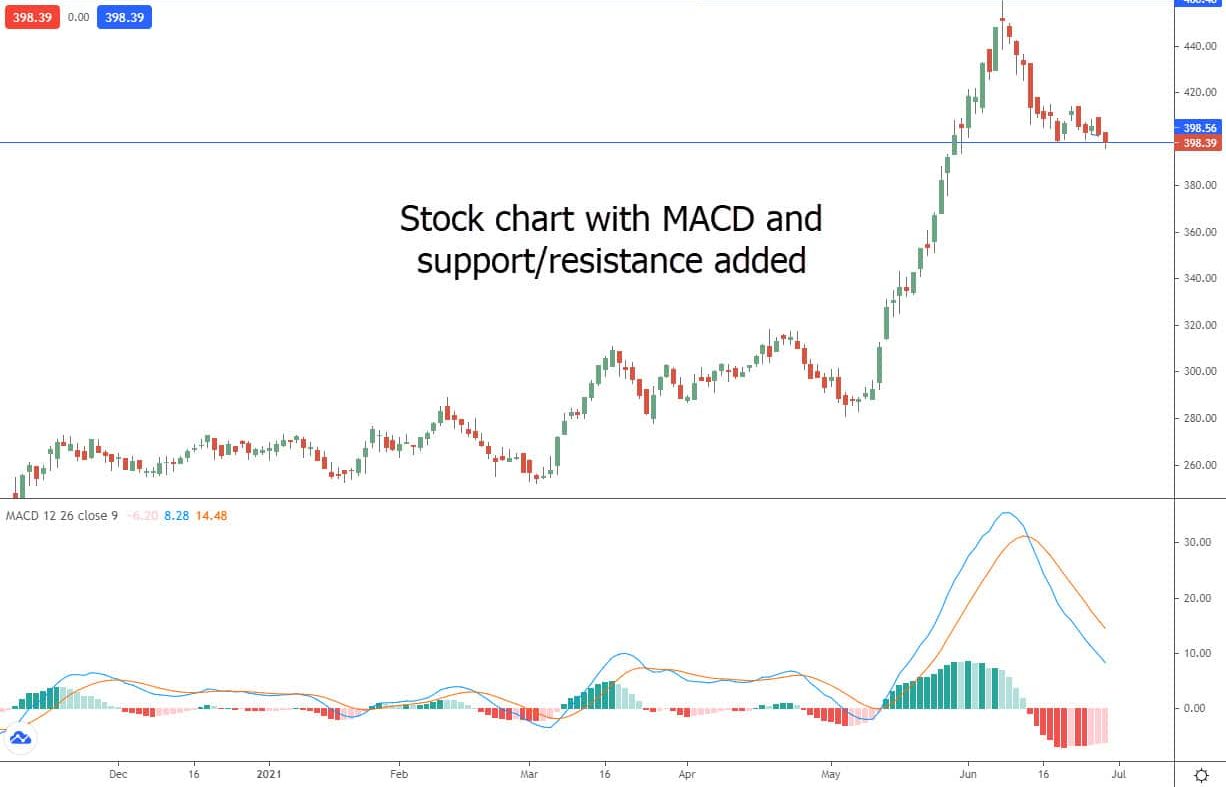
The MACD is a tool used by traders to examine previous price data and spot prospective changes in a stock’s trend. It works similarly to moving averages in this regard. When the MACD crosses above 0 and below 0, it is assumed that the stock’s price is likely to rise, and it is assumed that the price may fall. It should be mentioned that the MACD has its limitations, just as other indicators based on historical data.
Moving Average Convergence Divergence (MACD)
Applying Technical Analysis in Stock Trading
Identifying Trends
Trend trading is a strategy used by traders to forecast market direction by examining a variety of indicators. This technique is predicated on the notion that markets are somewhat predictable. Trading professionals try to predict future market moves by analyzing the data at hand. The three primary categories of trends are sideways, upward, and downward.
Trends are often detected using indicators like the RSI and moving averages. For trend traders, the 50-day and 200-day moving averages are very useful because they can show the market’s direction. If the price is above the moving average, an upward trend is likely; if it is below, a downward trend is likely. The RSI is useful for predicting when a trend is ending and may be due for a reversal, but it’s crucial to remember that markets can be overbought or oversold for a long time, and the RSI doesn’t ensure that a trend will soon reverse.
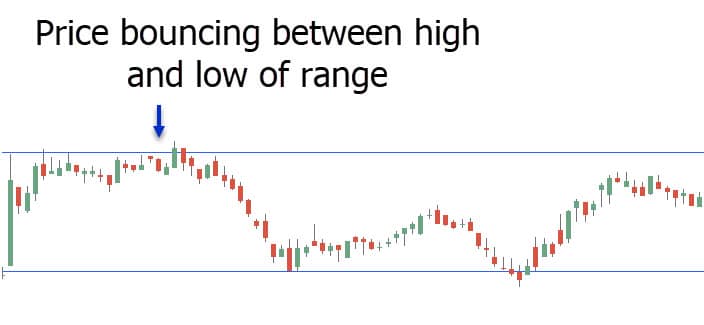
Recognizing Trading Ranges
As part of a simple trading strategy called range trading, investors seek to buy shares at the lower and sell them at the upper ends of a stock’s trading range. A range trader might attempt to buy shares at $90 and then sell them near $100, repeating this practice until they consider the company is no longer trading within that range, for instance, if it is now trading between $90 and $100 per share. For range traders, support and resistance levels are essential because they reveal the price band that a stock is trading in.
Recognizing Trading Ranges
Interpreting Candlestick Patterns
Technical analysis uses candlestick patterns to help forecast future price changes. Candlestick charts, such as daily trading, show data on price changes over a given time period. The body, which symbolizes the open and close range for that time period, the wick, which depicts the high and low of the day, and the color, which denotes whether the market is heading upward or downward, are the three key parts of each candlestick. Understanding different candlestick patterns can give traders insightful information about the market and aid in the identification of prospective trading opportunities.
Six bullish candlestick patterns that traders should know are the
- Hammer,
- Inverse Hammer,
- Bullish Engulfing,
- Piercing Line,
- Morning Star, and
- Three White Soldiers.
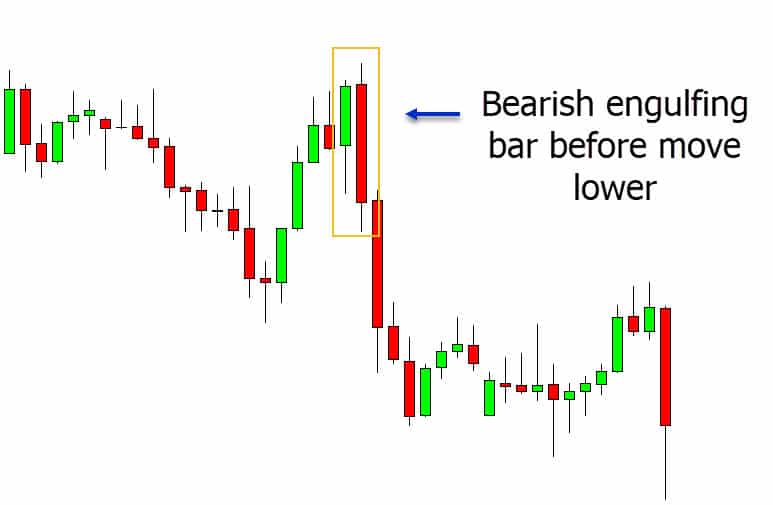
Six bearish candlestick patterns that traders should be familiar with are the
- Hanging Man,
- Shooting Star,
- Bearish Engulfing,
- Evening Star,
- Three Black Crows
- Dark Cloud Cover.
Interpreting Candlestick Patterns
Examining Volume
In order to forecast the direction of stock prices, this trading technique relies on the link between the quantity of shares being purchased and sold, also known as supply and demand. To determine whether the price of the stock is likely to climb or fall, volume traders look at the volume of shares traded. For instance, a sudden increase in the volume of shares being bought may be a sign that the stock’s price is set to rise. On the other hand, if there is a big volume of sales, it might be a warning that the stock’s price would probably fall.
Analyzing Stock Trends using Technical Analysis
Although it can be difficult, spotting a trending stock before the rest of the market can be an effective part of your investment strategy. Technical analysts utilize a variety of techniques, such as moving average indicators and keeping an eye out for high volume in a stock, to spot market patterns. Finding firms whose prices have increased beyond their 100-day moving average is a common technique since it can signal a surge in investor interest that could push the stock price even higher. However, keep in mind that there are ways to enter early and profit from the trend even if it isn’t possible to be the first investor in a hot stock.
Analyzing chart patterns is another tactic technical analysts employ to spot stock trends. Head and shoulders, cup and handle, and double bottoms are typical chart patterns. These patterns can reveal information about a stock’s present trend and potential future movement.
Search for equities that have just recently broken out of a trading range to spot trending stocks. A stock that has exited a trading range may be under heavy purchasing pressure and may be on the verge of an uptrend.
Technical analysts can spot trending stocks by using momentum indicators like the Moving Average Convergence Divergence (MACD) and Relative Strength Index (RSI). These indicators gauge how strongly a stock’s price moves and indicate when it is overbought or oversold, which can shed light on the trajectory of the stock.
Last but not least, it’s critical to remember that no one method or indicator will ensure success in spotting hot stocks. It’s crucial to combine several techniques and to constantly take the overall market environment and the stock’s fundamentals into account.
Lastly
Whether you utilize fundamental or technical analysis, it’s crucial to take various things into account while making trade selections in order to enhance your chances of success. Trading is not an exact science; there are no tried-and-true processes. Making educated decisions, maintaining consistency and discipline in assessing your risk, and being aware of market trends are all necessary for successful trading. When selecting whether to enter or exit a trade, the majority of successful traders take into account a variety of technical and fundamental criteria.
It’s crucial to keep in mind that no one indicator or trading method can ensure success in the stock market. To make well-informed decisions, it is frequently important to combine many techniques and viewpoints. Traders can comprehend the stock and its performance more thoroughly by combining technical and fundamental analysis.
Having a clear trading strategy and risk management plan in place is also essential. This aids traders in limiting their exposure to risk and maintaining their focus and discipline in their approach.
In conclusion, making high-probability transactions in a focused, disciplined manner while consistently assessing risk and exposure is the key to effective stock trading. By reflecting
using multiple factors, using a combination of methods, and having a well-defined trading plan and risk management strategy, traders can increase their chances of success in the market.