35 Powerful Candlestick Patterns
Candlestick patterns are some of the most powerful trading techniques.
Candlestick patterns help s find both bullish and bearish trades. They can also help you manage your open trades.
In this section, we will introduce 35 powerful candlestick patterns you can start using in your trading.
Japanese Candlestick Patterns
Japanese candlestick patterns are price action formations you can use to predict where the future price may go.
They are called candlestick patterns because they are formed on candlestick charts. Each candle shows a and form a repeatable pattern the high, low, open, and closing prices for a specific time frame. When multiple candles form over time, patterns emerge, and traders look for repeatable patterns to aid in entering and exiting a trade.
Technical analysts and pattern traders look to these patterns because they believe they show when the bulls or the bears are in control. This can lead to high probability trades.
Most traders use candlestick patterns as signals for buying or selling. There are both bullish and bearish Candlestick patterns exist for both bullish and bearish patterns.
In this section, we go through both types and explain how to use them.
Trading With Candlestick Patterns
As mentioned, most traders use candlestick patterns as entry signals. Candlestick patterns are also useful in managing open trades as they provide signals to set or modify take-profit targets and stop-loss levels.
One often overlooked, by very important factor is where candlesticks form and in they what context these formations occur.
To find the best trades using these patterns, you need to consider whether the market is trending or ranging in a certain direction, or if there are any identifiable levels of support and resistance.
For the best results, you will want to use a combination of candlesticks and other indicators to help confirm your trading theses. An example of this would be using some popular indicatorslike moving averages or the MACD. Again, the use of other indicators and price action analysis will help confirm high-probability trades and increase your chance of profitable trades.
35 Powerful Candlesticks Patterns
Here are 35 powerful candlestick patterns you can immediately start using in your trading. Remember that it is best to focus on mastering one pattern and then expand to another rather than try to learn all of these patterns at the same time. A free PDF of these 35 powerful candlestick patterns is also available.

1. Hammer
The hammer pattern is a single candlestick formation. It signals a potential reversal for a move back higher. The key to the hammer pattern is that it needs to either form at the end of a move or trend lower. It is best understood through example. The below chart shows a bullish hammer pattern. We can see that price opened and sold off heavily; however, by the end of the session, the bulls had roared back and taken over, signaling they were looking to price back higher
2. Bullish Engulfing Bar
The bullish engulfing bar is a high probability pattern that hints a reversal to the downside is about to take place.
This candlestick pattern forms when the engulfing bar completely engulfs the previous candle. There must be a lower low and higher high on the candle than that of the previous candlestick. This indicates that the bulls have taken control, and the price could be looking to make a move higher. If these pieces are in place, you have a valid bullish engulfing bar. Below is a good example to review.


3. Piercing Pattern
The piercing pattern is a pattern that is formed with multiple candlesticks. It is a bullish reversal pattern that forms after a move or trend is lower.
The first candlestick of this pattern is a significant bearish candlestick. It will have little to no wicks.
The second candlestick gaps lower than the previous candle, but buyers will then come in and the candle finishes above the mid-way (50%) point of the first candle. The below example shows a bullish piercing pattern setup.
4. The Morning Star
The morning star pattern is formed with three candlesticks. It is a bullish reversal candlestick pattern, and it forms after a move lower.
The first candlestick of this pattern is a large bearish candlestick.
The second candlestick is a doji that shows indecision and uncertainty after the move lower.
The third candlestick is a significantly bullish. This shows that, after the indecision of the doji candle, buyers have now taken control. See the example below.


5. Three White Soldiers
The three white soldiers’ pattern is a bullish candlestick formation that signals the potential of a new move higher.
This pattern is formed when three consecutive bullish candlesticks have little to no wick and they open within the body of the previous candlestick.
Tthe example below provides a nice illustration of the three white soldiers’ pattern
6. Three Inside Up
The three inside up candlestick pattern, like its name suggests is a pattern that is formed with three candlesticks.
This is a bullish reversal candlestick pattern, typically forming after a move lower.
The first candlestick of this pattern will be a large bearish candlestick.
The second candlestick is a small bullish candlestick that is formed entirely within boundaries of the first candlestick.
The last candlestick confirms the bullish reversal by moving upward and closing above the first candlestick.
Traders using this pattern typically take a long position once it has confirmed itself, which occurs with the last candlestick closing higher.
Below is an example of a Three Inside Up pattern.

7. White Marubozu
The white Marubozu pattern is a single candlestick pattern that suggests a bullish reversal back higher is coming.
The candlestick in this pattern has a long bullish body with little to no wicks on either side of the candle.
This shows that the bulls have taken over and further, that they were in control for the whole session.
See an example of this pattern below.
8. Bullish Harami
The bullish harami pattern is a two candlestick pattern that is suggesting a reversal higher.
The first candlestick of this pattern is a large bearish candlestick. It has a large body with little to no wicks on either end.
The second candlestick is a small bullish candlestick that must form entirely within the body of previous candlestick.
The Bullish Harami pattern should not be traded alone. It is most successful when used in conjunction with other market information such as the current trend and critical support and resistance levels.
Below is an example of the Billish Harami pattern


9. Inverted Hammer
The inverted hammer is a bullish reversal candlestick pattern.
This pattern must form at the end of a move or a trend lower.
To identify this pattern, the opening and closing prices are close to each other, but there must be a large wick that points higher.
See the example below:
10. Tweezer Bottom
The tweezer bottom candlestick pattern is a bullish reversal candlestick pattern utilizing two candlesticks that form at the bottom of a move lower.
These two candlesticks show the bulls looking to take control, which would then push the price back higher.
The first candlestick of this pattern is bearish, and the second candlestick is bullish.
The low of these candlesticks will be almost the same. This indicates a possible support level.
These patterns are popular in part because they form more often than others. Additionally, they can be used on all time frames.
Below is a Tweezer bottom pattern:


11. Three Outside Up
The three outside up is another bullish candlestick pattern hinting at a reversal to higher levels.
This pattern consists of three candlesticks that usually form after a move lower.
The first candlestick in the Three Outside Up pattern is a small bearish candlestick.
The second candlestick is a large bullish candle.
The third is another long bullish candle. This confirms that the buyers have taken control.
See the below illustration of Three Outside Up:
12. Bullish Counterattack
The bullish counterattack pattern contains two candlesticks hat indicate a potential bullish reversal.
This pattern forms after a move lower, and you then use it to try to ride the subsequent move back higher.
The first candlestick of the Bullish Counterattak is a long bearish candlestick with a large candle body.
The second candlestick has a significant bullish candlestick that closes at or near the first candlestick’s high.
This pattern shows that the bulls have moved in and are looking to push prices higher.

13. On-Neck Pattern
The on-neck pattern is a bearish continuation pattern. It is formed with two candlesticks.
This pattern suggests that the lower move will continue.
The first candle of this pattern has a long bearish candlestick.
The second candle has a small bullish candle, gapping below the first candle and then closing close to where the first candle closed.
This forms a horizontal neckline pattern as shown in the below illustration.
14. Dark Cloud Cover
The dark cloud cover is a bearish reversal pattern, forming after the price has been moving higher.
This candlestick pattern shows the price may be moving from being bullish to bearish.
The first candlestick of this multi-candlestick pattern, is a significant bullish candlestick. This shows the price should continue with the trend higher.
The second candlestick is bearish. This candlestick gaps above the first candle and closes below the 50% mark of the first candlestick.
Traders using this pattern typically take a short position at the completion of this pattern and at the opening of the next candlestick.
See the below example of a dark cloud cover pattern:


15. Hanging Man
The hanging man pattern is a single candletsick that suggests a bearish reversal lower.
This pattern must form after a move or trend higher in order to set up for the reversal lower.
To correctly identify the hanging man pattern, the candlestick’s body must be formed towards the top, and there is a long lower candlestick containing little to no upper wick.
See an example below of a hanging man pattern.
16. Bearish Engulfing Bar
The bearish engulfing bar pattern is the opposite of the bullish engulfing pattern.
This pattern hints that there could be a bearish reversal and move lower.
The bearish engulfing bar pattern must have a higher high and lower low than the previous candlesticks.
The price must close towards the bottom of the candlestick, which shows sellers were in control when the candlestick ended.
This formation shows the bears have taken full control and pushing prices lower.
Below is an example:


17. Three Black Crows
The three black crows pattern is similar to the three white soldiers’ pattern but three vblack crows is a bearish pattern.
This pattern hints the price could move lower because sellers are in control.
The three black crows pattern has three consecutive bearish candlesticks. Each one has little or no candlestick wicks.
The candles should all form within the previous candlestick’s body.
See an example below of the three black crows’ pattern.
18. Black Marubozu
The black Marubozu pattern is the bearish opposite of the white Marubozu pattern.
It is a single candlestick pattern indicating a set up for a bearish reversal.
This pattern forms after a move or trend higher.
This pattern forms with one large bearish candlestick having little to no wicks on either end of it.
The black Marubozu pattern shows that the sellers entered and controlled the selling for most of the candle’s duration.
Below is a black Marubozu pattern:


19. The Evening Star
The evening star pattern is a bearish reversal pattern, suggesting that the higher move is ending and a lower move is beginning.
This pattern is formed with three candlesticks.
The first candlestick is bullish.
The second is a doji candle that shows indecision in the market.
The third candlestick is a bearish candlestick, showingthe trend reversal.
Here is an evening start pattern example:
20. Three Inside Down
The three inside down pattern is a multiple candlestick pattern showing a potential bearish reversal.
This pattern will usually form after a move higher. Traders enter a trade using this pattern to ride the lower move.
The three inside down pattern’s first candle is a long bullish candle. The second candle is a smaller bearish candle, and the third is a larger bearish candlestick, which confirms thepatten.
Traders take a short trade after the third candle is confirmed and once this pattern the new candle opens.
Here is an example of the three inside down pattern.


21. Shooting Star
The shooting star is a bearish reversal candle that hints the price may be about to move lower.
This pattern needs to form after a move or trend higher.
The body of this candlestick needs to form towards the lower end of the candlestick, and there must be a sizeable upper candlestick wick.
See an example below:
22. Bearish Harami
The bearish harami pattern is the inverse, or opposite, of the bullish harami pattern, in that it is a bearish reversal pattern.
The bearish harami suggests that the bullish move could be ending.
The first candlestick in this pattern is a large bullish candle. The second is a small bearish candle, and this candle forms inside the previous candle’s open and close.
Traders will enter a short position when this pattern has been confirmed and the new candle opens
Below is an example of the bearish harami pattern:


23. Tweezer Top
The tweezer top pattern is the inverse of the tweezer bottom pattern. Tweezer top will indicate a potential reversal to the downside.
This pattern is formed with two candlesticks. The first candlestick is bullish, and the second is bearish.
The key to this pattern is both candlesticks will have almost the same high. This shows resistance, and the second candlestick suggests that the bears took over and are pushing the price lower.
This pattern typically forms after a higher move, and traders use it as a signal to enter new short trades.
Below is an example of the tweezer top pattern:
24. Bearish Counterattack
The bearish counterattack pattern is the inverse of the bullish counterattack.
This is a bearish reversal pattern. It indicates a possible sell off and move lower.
This pattern will typically form after a move or trend higher.
The first candlestick of this pattern is a large bullish candle containing little to no wicks. The second candle gaps higher, but will close lower and near the first candle’s closing price.
See the Bearish Counterattack example below:


25. Doji
The Doji candlestick pattern shows indecision in the markets.
The Doji is formed after the bulls and the bears have struggled to gain control resulting in a large upper and lower wick, and the price ends up closing near the middle of the candlestick.
This single candlestick pattern will form with higher and lower candlestick wicks and a small candlestick body.
See an example of a Doji candlestick pattern below:
26. Three Outside Down
The three outside down pattern is a bearish reversal pattern of three candlesticks. It usually forms after a strong move higher.
The first candlestick is a short bullish candlestick, followed by a large bearish candle that fully engulfs the previous candlestick. The third candle of this pattern is also bearish and closes below the second candle.
Traders will enter a short trade once this pattern has been confirmed, and a new candle opens.
See the example of a three outside down pattern below:


27. Spinning Top
The spinning top is very similar to the doji candlestick pattern.
Both patterns have upper and lower wicks, but the spinning top pattern has a larger candlestick body.
The spinning top, like doji, indicates indecision in the market, and buyers and sellers have been fighting for control.
See below for an example of a spinning top candlestick pattern:
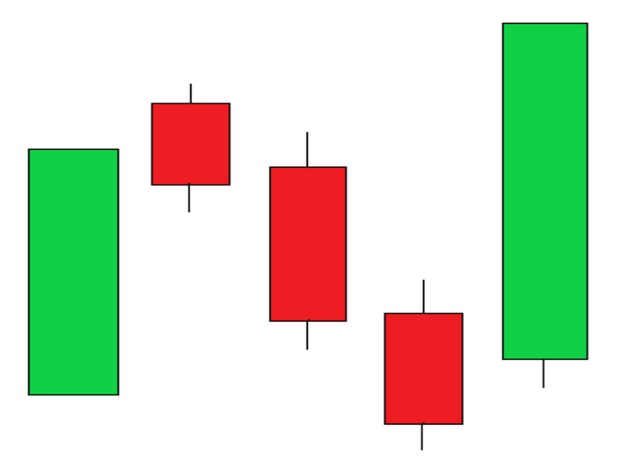
28. Falling Three Methods
The falling three methods pattern is a continuation pattern. It contains five candlesticks that signal a continuation of the trend lower..
This pattern also shows there was a pause in the lower trend, but that it may be about to continue with the down trend.
The falling three methods pattern is created with the first candlestick forming in the same direction as the trend. Then, the folllowng three candles are small bullish candles, followed by the fifth candle that reverses and continues on the down trend.
This pattern shows that the bulls tried to push the price higher, but they did not have enough momentum to reverse the trend to the upside.
See the below example of the falling three methods pattern:
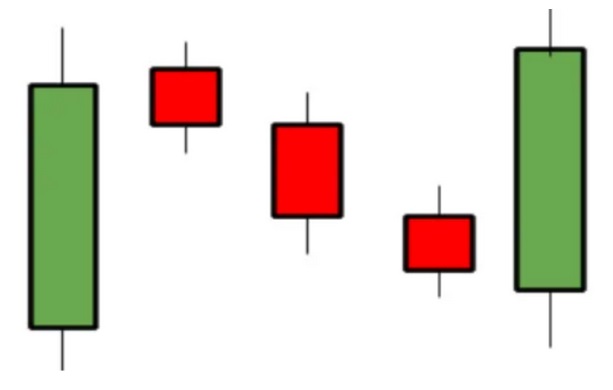
29. Rising Three Methods
The rising three method pattern is the the falling three method pattern’s inverse.
This pattern shows that a trend higher was interrupted, but will likely to continue.
In this pattern there are two large bullish candlesticks on each end, and three small bearish candlesticks in the middle.
This signals the bears tried to gain control and reverse the trend but failed.
See the below example of the rising three methods pattern:
30. High Wave
The high wave pattern shows indecision in the price and neither the bulls nor the bears are in control.
This pattern usually forms in support or resistance areas.
Like other patterns of indecision, the high wave pattern will have very long upper and lower candlestick wicks and a small body.
This shows that the bulls and the bears both struggled for control but neither prevailed.
Below is an example:


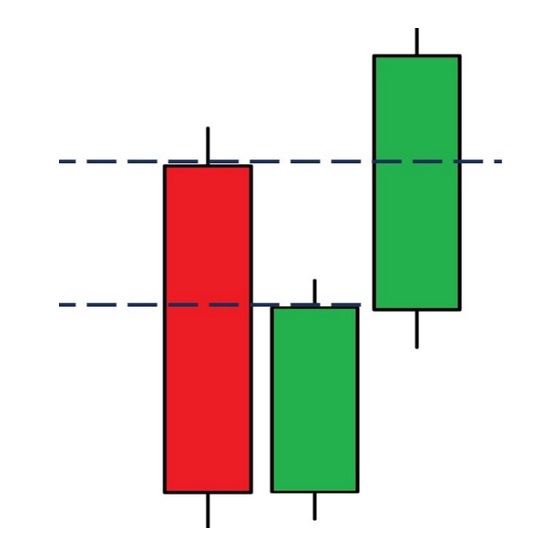
31. Downside Tasuki Gap
The downside Tasuki gap pattern is a bearish continuation pattern. It suggests a continuation of the lower trend.
This pattern is a three candlestick pattern. The first candle is a large bearish candlestick. The second candle is a large bearish candle that has gapped down. The third candlestick is a bullish candle that closes the gap created by candlestick two.
This pattern forms within a trend lower, and it can be used to identify when the price could be ready to move lower.
An example of the downside Tasuki gap is below:
32. Upside Tasuki Gap
The upside Tasuki gap pattern is the inverse of the downside Tasuki gap.
The upside pattern is formed with three candlesticks and indicates a continuation of the higher trend.
The first candlestick in this pattern is a large bullish candle. The second is another bullish candle, gapping above the first candle.
The third candlestick is bearish, closing the gap created by the first two candles.
The upside Tasuki gap is used to identify when the price may continue the uptrend.
Below is an example of the upside Tasuli gap:

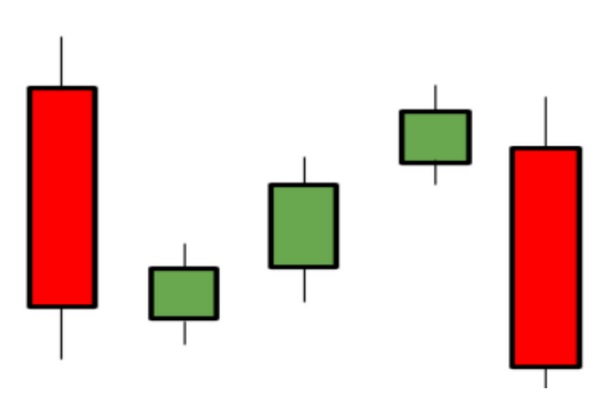
33. Mat Hold
The mat hold pattern is a continuation pattern. It indicates either a trend higher or trend lower may continue.
There are both bullish and bearish mat hold patterns, and these can be a very helpful tool in managing open trades.
A bullish mat hold pattern is created with five candles.
The first candlestick is a large bullish candle. The second candlestick gaps higher but ends red. The next two candlesticks are small bearish candles, and the final candlestick is a large bullish candle.
This patterns, similar to the three methods’ patterns, show a failed attempt at a trend reversal and continuation.
See the below bullish mat hold example:
34. Rising Window
The rising window pattern is a continuation pattern that indicates that the price will continue with the uptrend.
This is a two candlestick pattern, with both candlesticks being strong bullish candles. The second candle opens higher than the first, creating a gap between the two.
This pattern is useful to identify a continued bullish trend.
See the rising window example below with the gap noted:


35. Falling Window
The falling window pattern is the inverse of the falling window pattern.
This pattern indicates that the price may continue a move or trend lower.
The falling window pattern is also a two candlestick pattern that is usually formed with two bearish candlesticks.
The second candlestick gaps lower than the first.
This pattern is useful in indicating sellers are still in control. As such, a lower trend may continue.
See the falling window example below with the lower gap highlighted:
Conclusion
In this section we shared 35 powerful candlestick patterns with examples to help traders become more profitable. As you can see, there are a lot of profitable patterns, but it is most beneficial to become very familiar with one pattern and perfect it rather than trying to use multiple patterns where you only have general knowledge.
The great thing about candlestick patterns is that they work on multiple time frames, and they can be applied in a range of markets.
The key to any of these patterns is the market’s price action, when and where they form.
Even as you progress, you don’t need to know all these patterns. Find your favorite patterns and master those. If you do, you should see your profits increase.
Related Projects

Startup Funding
Investing / Startup