
Technical analysis relies heavily on chart patterns because they reveal anticipated price movements based on supply and demand forces in the market. Traders can more accurately forecast future price movements in any asset class by recognizing these patterns. The numerous kinds of chart patterns, their importance in trend reversal, and how to spot them in various time frames are all covered in this article.
The most typical chart patterns, such as head and shoulders, double tops and bottoms, triangles, and flags, will be covered in this guide. We’ll also go through how to use these patterns in conjunction with other technical indicators, like moving averages and RSI, to support their validity and raise the likelihood that a trade will be profitable.
Table of Contents
- Introduction to Chart Patterns
- Classic Chart Patterns:
- Forex Chart Patterns:
- Stock Chart Patterns:
- Chart Patterns Cheat Sheet: Identifying and Profiting from Popular Patterns
- Conclusion and Further Resources
Introduction to Chart Patterns
Chart patterns are graphical representations of price changes of a particular item over a predetermined amount of time used in technical analysis. These patterns can be seen in all time frames and asset classes and are produced by the placement of candlesticks on a chart.
Because they help traders swiftly interpret the price action and come to wise judgments, chart patterns are a crucial component of technical analysis. Reversal patterns and continuation patterns are the two groups into which they can be separated.
- Reversal patterns signal a change in trend direction, such as double tops and bottoms or head and shoulders.
- Continuation patterns, on the other hand, indicate that the current trend will persist, such as bullish and bearish pennants or flags.
Bearish patterns provide a potential sale signal, and bullish patterns suggest a potential buy signal. Chart patterns can also be categorized as bullish or bearish. For traders, understanding and recognizing chart patterns can be a useful tool in making decisions.
Classic Chart Patterns: Double Tops, Double Bottoms, and Head and Shoulders
The following chart patterns are some of the most popular in all financial markets. For traders to execute wise transactions, it is imperative that they become familiar with these patterns.
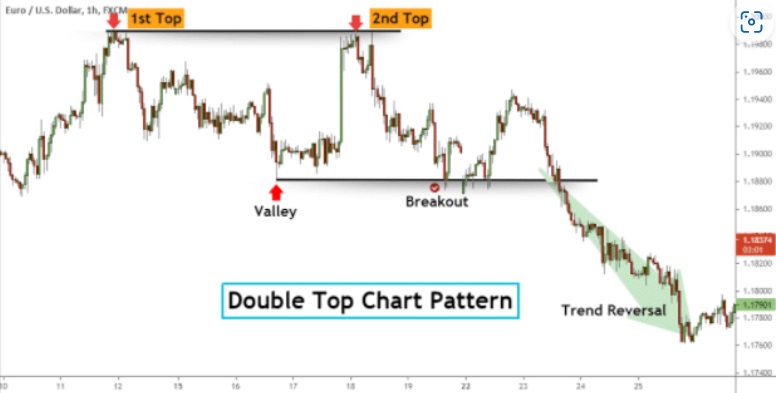
Double Tops
A downtrend begins when a double top pattern appears, which is a bearish reversal pattern that signals the end of an uptrend. It is distinguished by two separate price peaks that roughly coincide and are separated by a price decline. When the price breaks through the area between the two peaks, the pattern is verified and a potential selling opportunity is indicated. Due to its shape, this pattern is frequently referred to as the letter “M.”
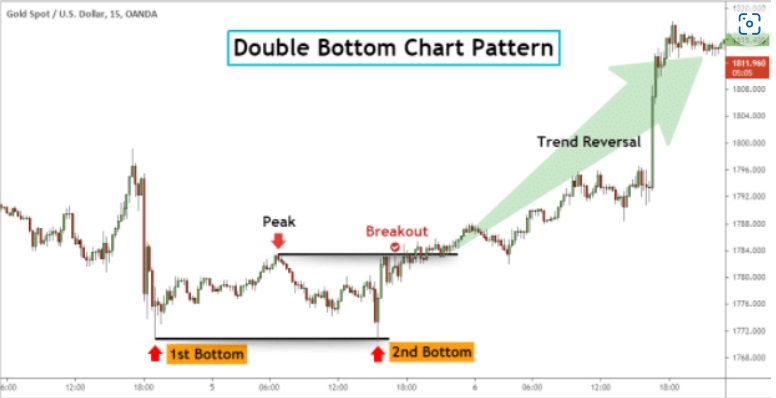
Double Bottoms
Indicating a potential change in trend from a downtrend to an uptrend, the double bottom is a reversal chart pattern. As a result, investors may search for chances to purchase the asset. The pattern resembles the letter “W” and is characterized by two different lows at comparable price levels. After the initial low, there is a price rise and a failed attempt to retest it. When the price surpasses the peak created between the two lows, the pattern is considered to be complete.
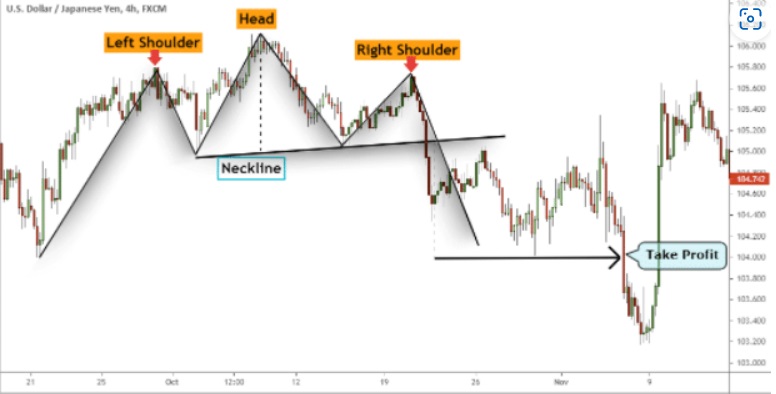
Head and Shoulders Pattern
In technical analysis, the head and shoulders pattern is a negative reversal pattern that suggests the likely end of an uptrend. It suggests that the price is most certainly going down, providing traders with an excellent opportunity to sell. Three peaks make up the formation, with the central peak being the tallest and the other two being almost the same height. When the price closes below the “neckline,” a trendline that connects the two valleys on either side of the central peak, it confirms the pattern and signals the possibility of a trend reversal.
Forex Chart Patterns: Bullish and Bearish Flags, Symmetrical Triangles
Chart patterns are frequently used by forex traders to spot prospective buying or selling opportunities in the foreign exchange market. Triangles, rectangles, bullish and bearish flags, among others, are some of the most popular patterns. Although the complexity of these patterns can vary, they all offer insight into the timing of trades.
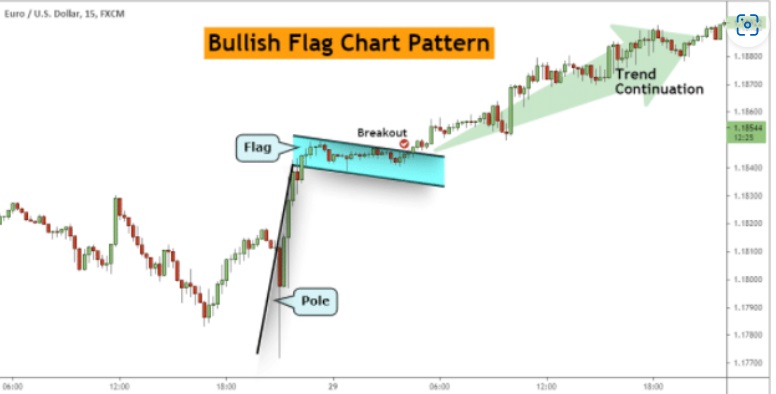
Bullish
Technically speaking, the bullish flag pattern indicates that the market’s upswing will continue. Following a significant upward rise, it is defined by a period of consolidation. The buy signal is given when the price breaks out of this consolidation and moves in the upward trend. This pattern is frequently observed in currency pairings that have a strong upward trend, and it is regarded as a favorable occasion for traders to open long positions.
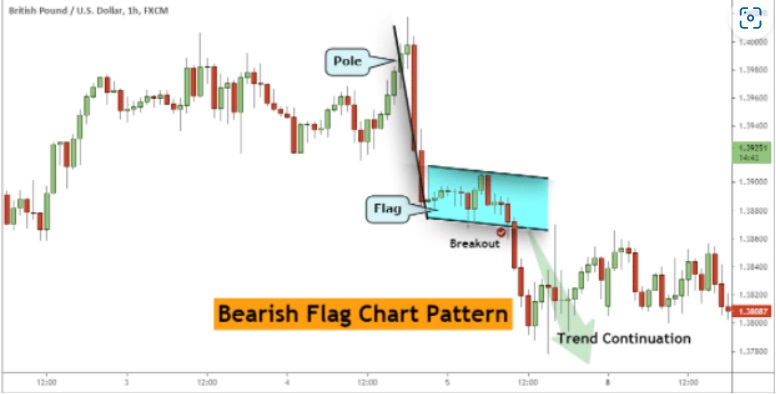
Bearish Flags
The continuation pattern known as the bearish flag price formation indicates that a decline is pausing before the current trend picks back up. This indicates that the pattern causes the price to decrease, thus traders must search for buying chances. The most trustworthy bearish signs can be seen in currency pairs that are strongly trending down.
The bearish flag pattern is made of two key elements:
- A pole is depicted by a pre-existing downtrend.
- The flag, which is depicted by an area of tight consolidation that shows a counter-trend move. This consolidation can be contained within two parallel lines of support and resistance.
The sell signal is triggered when the price breaks out of the consolidation in the direction of the prevailing downtrend.
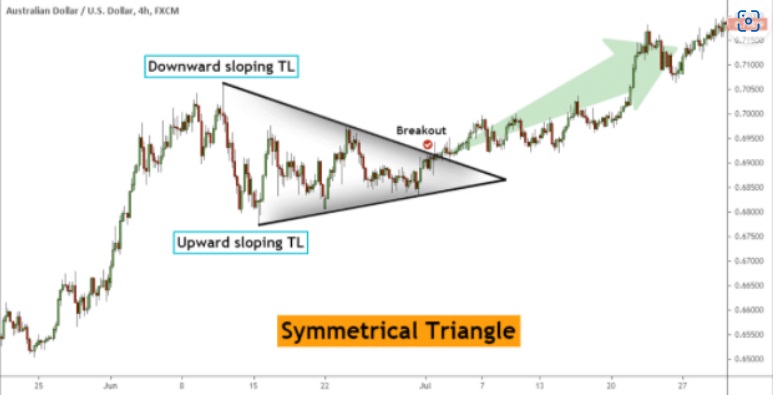
Symmetrical Triangle
A symmetrical triangle is a neutral pattern in technical analysis that doesn’t suggest a specific trading direction. It can be recognized by a resistance line that slopes downward and a support line that slopes upward that finally meet. Prices within the triangle exhibit a trend of rising lows and falling highs. If the downward trendline is broken upward, a trader will buy, and if the upward trendline is broken downward, a trader will sell.
A symmetrical triangle is a continuation pattern, which means that it represents a pause in the current trend rather than a trend reversal. This is vital to keep in mind. A trend’s underlying direction can be inferred from the triangle’s breakout direction. A breakout above the resistance line indicates a continuation of the uptrend, while a breakdown below the support line indicates a continuation of the downtrend.
In order to validate the breakout and raise the likelihood that a trade will be profitable, traders frequently use other technical indicators, such as volume or momentum. To control risk and maximize their trade, traders can also utilize profit objectives and stop-loss orders.
It is important to note that symmetrical triangles are not always accurate, and traders should take other aspects into account before making a trading decision, including economic data, news events, and other technical indicators.
Stock Chart Patterns
The most common stock chart patterns and their attributes will be described in this section. Channels, rectangles, cups with handles, head and shoulders, and rounded tops and bottoms are a few of the most well-known patterns.
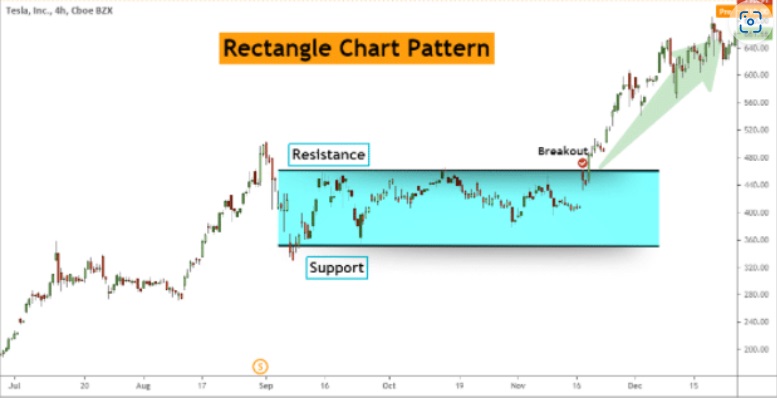
Rectangle Patterns
Technical analysis’s rectangle pattern is a continuation chart pattern that could signal a probable trend reversal or only a pause before the prior trend resumes. When the price oscillates between two horizontal lines of support and resistance, a pattern is present. Breaks above or below the pattern indicate buying or selling, respectively.
The length of the rectangle pattern’s consolidation phase can also shed light on the likelihood of a trend reversal or continuation and its possible strength. A lengthier period of consolidation could be a sign of the trend continuing or sharper trend reversal. In addition to the rectangle pattern, traders may utilize additional technical indicators or chart patterns to support their analysis and help them make better trading decisions.
Channel Patterns
Similar to the rectangle pattern in technical analysis, a channel is a pattern when the price is constrained between two trend lines that are sloping in opposite directions.
There are two types of channels:
- bullish channels, where the trendline slopes upward.
- bearish channels, where the trendline slopes downward.
When the price approaches the higher resistance boundary or the lower support border, traders who favor range-bound markets will sell and buy, respectively. Trading on a price range breakout is an additional choice.
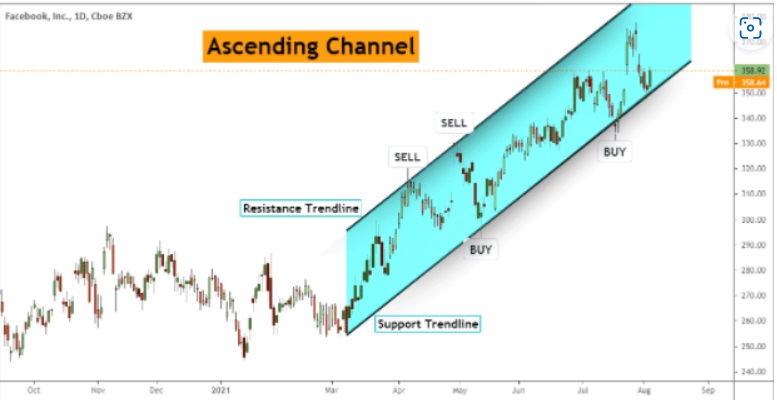
Chart Patterns Cheat Sheet: Identifying and Profiting from Popular Patterns
To help traders quickly recognize the essential traits of the most widely utilized price action patterns, we give the best candlestick pattern cheat sheet.
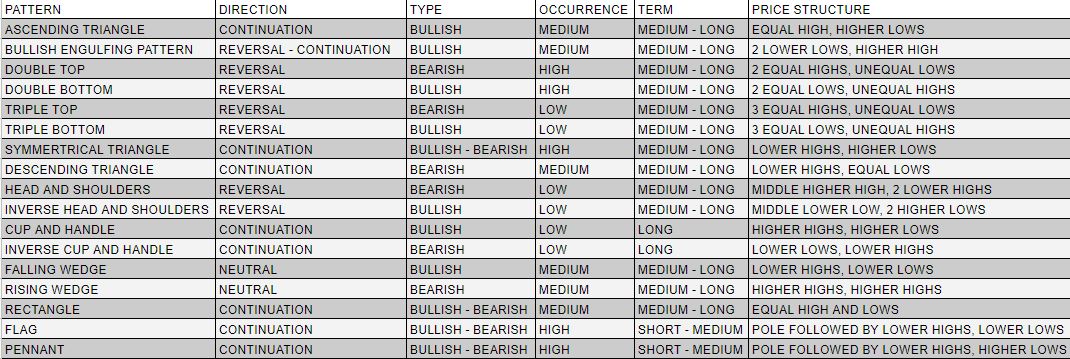
Chart Patterns Cheat Sheet: Identifying and Profiting from Popular Patterns
Most Profitable Chart Patterns
The bullish and bearish flag formations and the head and shoulders pattern are the most successful chart patterns, according to Thomas Bulkowski, editor of “Encyclopedia of Chart Patterns.” When these patterns satisfy at least three criteria—appearing in the right place relative to the general trend, being larger in size than the surrounding candlesticks, and being in line with the present market conditions—they are deemed to have a high probability of occurring (trend, range, or breakout mode). The head and shoulders pattern is a reversal pattern, whereas the flag formations are considered as continuation patterns.
Lastly
It is advised to practice on a demo trading account in order to increase your capacity for chart pattern recognition. Chart patterns should be used in conjunction with other technical analysis methods to corroborate the general trend, it is crucial to mention. Remember that variances may occur and that chart patterns may not always emerge in exact textbook form.
Furthermore, it’s crucial to avoid using chart patterns as your only indicator while making trading selections. As one of the numerous instruments in your analysis toolset, it should be employed instead. A chart pattern’s past performance is not a guarantee of its future performance, and other market elements like economic and political developments might have an impact on the market as well. Your capacity to recognize them in real-time can be enhanced by consistently studying and examining various chart patterns and market circumstances.