
On a daily basis, traders from all over the world use their brokerage accounts to trade assets on the financial markets in an effort to profit. Traders use a variety of techniques and strategies designed to take advantage of market opportunities in order to accomplish this goal. These methods and tactics either use technical analysis or fundamental analysis. We will focus on a specific technical trading strategy that relies on support and resistance levels in this post. We will look at what these levels mean, how to spot them, and effective trading methods that may be used with these technical indicators..
Free PDF Guide : Get your Maximizing Profits with Support and Resistance Trading Strategy
Table of Contents
- Understanding Support and Resistance
- Support and Resistance Areas
- Locating Support and Resistance Levels
- Identifying Robust Support and Resistance Levels
- Trading Strategies using Support and Resistance
- Breakouts of Support and Resistance
- Support and Resistance Indicators
- Lastly
Understanding Support and Resistance
Because it is so important in trading, support and resistance are a hot topic in technical analysis. Although the fundamental idea of support and resistance is simple, traders will find it difficult to understand once they realize that these levels come in a variety of shapes. Let’s begin by gaining a fundamental grasp of support and resistance.
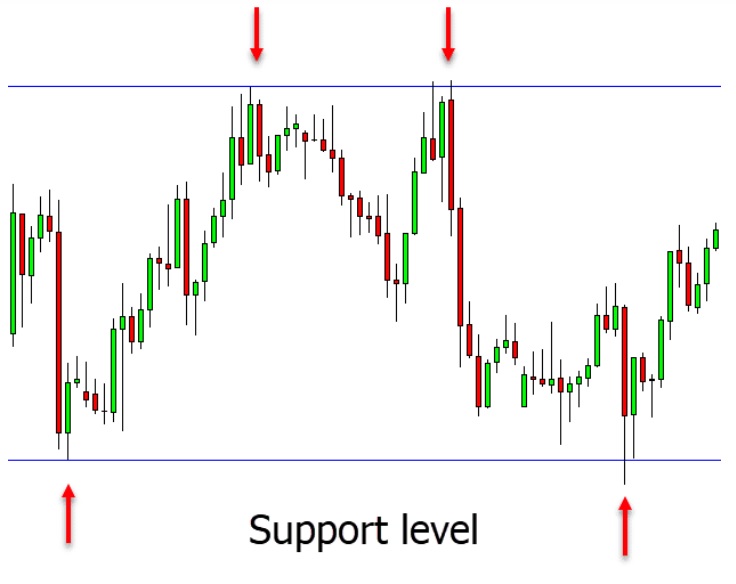
In a downtrend, the price of stocks keeps falling until it reaches a “floor,” after which it appears reluctant to continue falling. Support level describes this level. In contrast, during an uptrend, stock prices increase until they reach a “ceiling” that acts as a barrier to further gains. This point is referred to as a resistance level. As a rule, stocks will fluctuate in price between these levels of support and resistance, bouncing off the support level when the price drops too low or the resistance level when the price rises too high.
You might be wondering what factors into the support and resistance levels. Are they predetermined or do they have a purpose? A fascinating subject is the psychology of support and resistance levels. Three sorts of players are often present in financial markets: those who are long and waiting for the price to climb, those who are short and waiting for the price to fall, and those who are unsure and waiting for a better entry point. Terms like “human behavior,” “fear,” “greed,” and “herd instinct” are frequently used to describe how participants in financial markets behave.
Human psychology must be taken into account when determining support and resistance levels because it greatly affects the price movements seen in markets. The optimism and pessimism felt by the three categories of participants listed above can be seen visually in chart patterns. For instance, when the price reverts to a support level, fear and greed are obvious. While short traders buy to cover their positions out of fear of losing money, long traders add to their positions to boost their long-term profits. Additionally, traders have a tendency to gather near these levels, which strengthens herd behavior.
Therefore, market psychology, human behavior, and broader market forces like supply and demand contribute to the levels of support and resistance. These levels are used by traders to determine the entry and exit positions for transactions.
Support and Resistance Areas
Support and resistance levels generally develop when many traders congregate at nearby price points. Because they indicate a broad area where support and resistance may be found, these levels are frequently referred to as zones. These areas are crucial in defining the price range that a security may trade in. However, as they could be influenced by erratic market changes, determining these zones can be difficult and subjective for traders.
These zones are used by technical traders to analyze past price movements and predict future ones. Traders can find them by using basic technical analysis tools like horizontal lines or more sophisticated indicators like Fibonacci retracements. Below, we’ll go through these instruments and indications in more detail. Despite the availability of these tools, traders must use their judgment and experience to pinpoint the areas that are most likely to operate as support or resistance levels in order to accurately identify these levels.
Locating Support and Resistance Levels
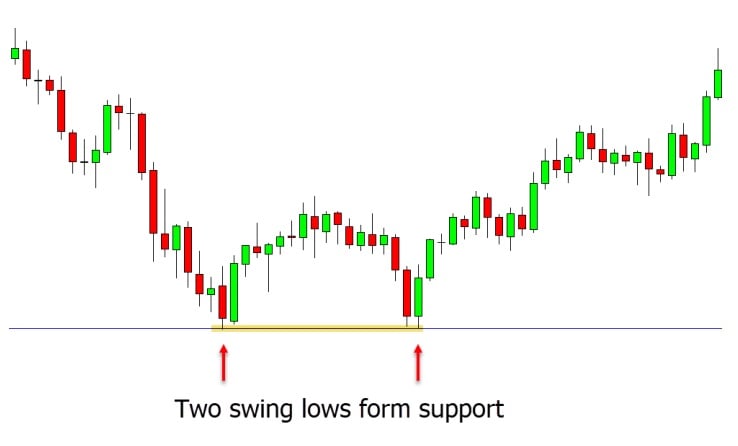
It might be challenging to distinguish real support and resistance levels from market price swings that are purely random. However, traders can use a variety of strategies to get over this obstacle. The first technique entails using historical price data to determine the highs and lows of a security’s price chart.
This method’s fundamental idea is that traders can keep track of how frequently the price of a securities tests its noted highs and lows. Traders can draw the conclusion that there is dependable support and resistance at certain levels if the price frequently bounces off them. However, as popular wisdom does not always hold true in the financial markets, traders should proceed with care and employ additional indicators to back up their claims.
Using pivot points or moving averages is another approach to locate areas of support and resistance. To determine the trend’s direction, traders can draw a diagonal line connecting the highest peak with the lowest peak. The moving average will serve as a support line if the trend line rises upward, and vice versa. As these levels are dynamic, traders refer to this strategy as dynamic support and resistance.
Identifying Robust Support and Resistance Levels
When a security’s price dips below its support levels, buyers may take advantage of the opportunity to buy shares at a discount. By pushing the price back up to its prior trading range, this increase in buying demand may cause a Wyckoff Spring. A Wyckoff Upthrust occurs when a security’s price falls back down after rising over its resistance levels as a result of traders rejecting the price increase. Trading professionals can confirm the potency of support and resistance levels by spotting these changes.
Finding solid support and resistance levels, meanwhile, can be difficult when a stock is trending because these levels might change over time. Generally speaking, in an uptrend, past resistance levels will turn into new support levels, and in a downturn, former support levels will turn into new resistance levels.
It is important for traders to remember that even strong support and resistance levels can be breached under certain conditions, such as when the market is affected by outside influences. For instance, the US stock market fell for a month after the World Health Organization designated Covid-19 a pandemic, and successive support levels were broken. Therefore, traders should constantly be cautious and take into account various indicators to support their findings.
Trading Strategies using Support and Resistance
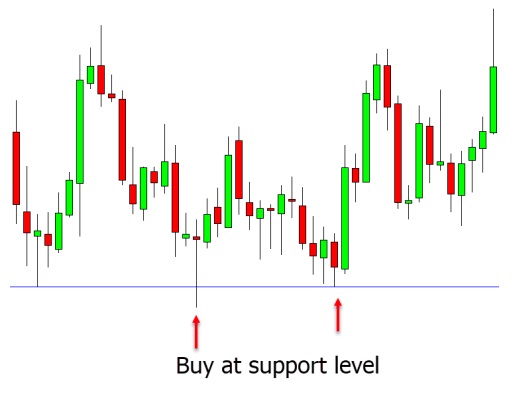
Trading methods based on support and resistance levels are fundamental tactics that traders might use in their trading activity. They support traders in risk management, market analysis, and selection of advantageous entry and exit locations. The buying of a security as it approaches a support level and the selling of it when it reaches a resistance level are two of the most fundamental trading methods. However, after a security reaches its resistance level, traders may choose to short it, closing their short positions when the asset retraces towards its support level. Trading this method requires waiting for evidence that the market is moving in the desired direction by employing other indicators, such as moving averages or the relative strength index (RSI).
The breakout approach, which entails waiting for the price of the security to move outside of its support or resistance levels, is an additional tactic. To verify the validity of the breakout, traders should use technical indicators like volume. Additionally, they should take caution when employing the breakout method because, despite popular belief, a breakout’s strong volume does not always indicate that the breakout is real. In order to rapidly close the trade if the security’s price experiences a breakout, traders should set their stop losses below support or above resistance.
Before engaging in a transaction, traders should decide on their profit targets and the maximum amount of loss they are prepared to take.
Breakouts of Support and Resistance
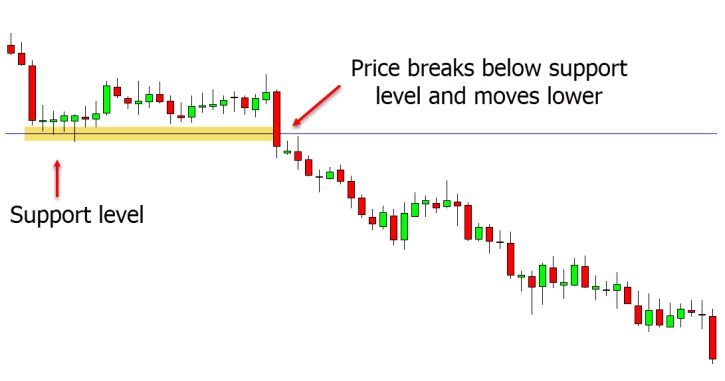
When a security’s support or resistance levels are broken, a breakout occurs, giving traders the chance to use the breakout technique to capitalize on these price changes. A breakthrough could be influenced by fundamental and technical variables. For instance, earnings releases are a fundamental occurrence that might lead to a breakout in a stock’s price. On the other hand, stop-loss orders placed by traders at specific levels above or below support or resistance may result in a breakout. If the price fluctuates more than expected, it may cause untold numbers of positions to automatically close, pushing the price of the security further up or down and causing a spike in volume that will serve to confirm the breakout to other traders and cause an even stronger breakout in the price of that security.
Support and Resistance Indicators
To aid in their analysis of the financial markets, traders have created a number of indicators. The Fibonacci retracement tool is one of these tools that is particularly helpful for trading using a support and resistance method. This technique can be used to create levels of support and resistance between any two important price points using the Fibonacci numbers, which are seen frequently in nature and are thought to be common in the financial markets. On charting platforms like TradingView and MetaTrader, additional custom indicators are also available, such as Support and Resistance (Barry). These indicators show lines and the most recent high and low points, making it simple for traders to see where support and resistance levels are located. After examining a security’s chart on TradingView, traders must choose the Support and Resistance (Barry) indication from the list of indicators before applying it.
Lastly
Trading techniques, such as trading support and resistance levels, are not infallible and will eventually fail. Although it is a well-known and straightforward idea, its limits are due to the subjective nature of determining support and resistance levels. Trading activity should therefore incorporate effective risk management. To limit potential losses if a trade does not go as planned, they should decide how much they are willing to lose in total and set a hard stop loss.