
Candlestick patterns are a useful tool for maintaining open positions as well as for spotting bullish candlestick patterns and bearish transactions. This article discusses 35 practical candlestick patterns that you may utilize right now in your trading plan.
You can learn more about market mood, price changes, and prospective trading opportunities by utilizing these patterns. Including candlestick patterns in your research can improve the precision of your trades, regardless of your level of experience. Start integrating these effective trading strategies into your plan right away.
Table of Contents
- Introduction to Japanese Candlestick Patterns
- Trading with Candlestick Patterns
- Overview of 35 Powerful Candlestick Patterns
- Hammer
- Bullish Engulfing
- Piercing Pattern
- Morning Star
- Three White Soldiers
- Three Inside Up
- White Marubozu
- Bullish Harami
- Inverted Hammer
- Tweezer Bottom
- Three Outside Up
- Bullish Counterattack
- On-Neck
- Dark Cloud Cover
- Hanging Man
- Bearish Engulfing
- Three Black Crows
- Black Marubozu
- Evening Star
- Three Inside Down
- Shooting Star
- Bearish Harami
- Tweezer Top
- Bearish Counterattack
- Doji
- Three Outside Down
- Spinning Top
- Falling Three Methods
- High Wave
- Rising Three Methods
- Downside Tasuki Gap
- Mat Hold
- Upside Tasuki Gap
- Rising Window
- Falling Window
- Conclusion
Introduction to Japanese Candlestick Patterns
In candlestick charts, candlestick patterns are graphic configurations that are used to forecast price movement.
They are relied upon by traders who think they show market patterns, resulting in profitable transactions, and are named from the charts they appear on.
These patterns are frequently used by traders to identify buying and selling signals.
This article discusses how to use both bullish and bearish candlestick patterns in trading.
Trading with Candlestick Patterns
Candlestick patterns are frequently used by traders as trade indications. They can, however, also be used to control open positions by establishing take-profit and stop-loss levels.
Retail traders frequently ignore the importance of candlestick formation location and market context.
In order to achieve the best outcomes, take into account additional data, such as market trends, support and resistance levels, and use indicators like moving averages or MACD to boost the likelihood of profitable trades by validating high-probability bets through price action research.
Overview of 35 Powerful Reversal Candlestick Patterns
Here is a thorough list of 35 powerful reversal candlestick patterns that you can use in your trading plan. Clicking the link below will take you to a free PDF handbook with all 35 potent candlestick patterns.
1. Hammer
A single candle configuration known as the Hammer pattern suggests that the trend may be turning upward.
Its effectiveness comes from the fact that it takes place toward the end of a negative trend or price movement.
A bullish takeover and prospective price increase are suggested by the chart’s early price decline followed by a robust rebound at the end of the timeframe.
Hammer
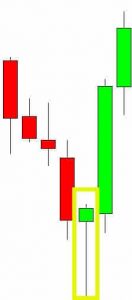
2. Bullish Engulfing
The Bullish Engulfing Bar is a dependable sign that a negative trend is about to reverse. When the current candle completely encloses the previous one, it becomes visible. It is one of the bullish candlestick patterns.
The new candle must have a higher high and lower low than the previous candle in order to validate a bullish engulfing bar. This denotes a total takeover by bullish forces, which can result in a fresh upward price trend.
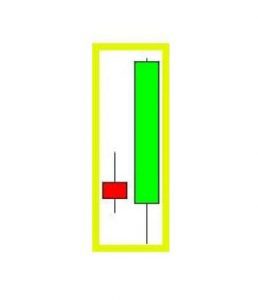
Bullish Engulfing
3. Piercing Pattern
A multiple candle formation called the Piercing Pattern indicates the possibility of an upward reversal.
It ought to develop at the conclusion of a downward price movement or trend. A notable bearish candle with little to no shadow opens the pattern, which is followed by a gap lower candle that closes above the prior candle’s midpoint, signifying the presence of buyers.
4. Morning Star
After a downward trend or price movement, a three-candle bullish reversal formation called the Morning Star pattern will appear. Large bearish candles open the chart, which is then followed by a doji candle that represents uncertainty and a decisive bullish candle that shows the takeover of buyers.
It’s important to keep in mind that the doji’s placement inside the pattern—specifically, where it lies between the lows of the first and third candles—is crucial. When the doji reflects the change in power from bears to bulls by opening lower than the first candle and closing above its midway, the pattern’s validity is furthered.
5. Three White Soldiers
A bullish multi-candle configuration known as the Three White Soldiers pattern denotes an impending higher market movement.
Three consecutive bullish candles that open inside the body of the previous candle and have little to no shadow combine to form the pattern. A potential trend reversal is indicated by this string of candles, which exhibit sustained strength and bullish mood.
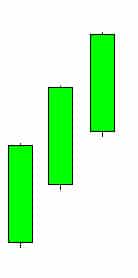
Three White Soldiers
6. Three Inside Up
A three-candle bullish reversal configuration known as the Three Inside Up pattern comes after a negative movement.
A massive bearish candle, a little bullish candle that is completely enclosed by the first, and a bullish candle that closes higher and indicates a reversal make up the pattern. After the third candle closes higher and verifies the reversal, traders frequently open a long position.
7. White Marubozu
The lengthy white candle with little wick on either end is a hallmark of the white Marubozu, which suggests a possible bullish reversal. This suggests that during the whole trading session, the bulls were in control.
Strong bullish mood is indicated by the white Marubozu pattern, which has a long bullish body without wicks. This suggests that the bulls controlled trading throughout the day and suggests that prices may be about to reverse to the upside.
White Marubozu
8. Bullish Harami
A multi-candlestick signal of an upward reversal, the bullish harami pattern. It is made up of a sizable bearish candle that is totally enclosed by a smaller bullish candle.
Before choosing a trade, traders should take into account other market characteristics including trend and support/resistance levels in addition to this pattern. A single candlestick pattern called the inverted hammer indicates a potential upward reversal.
When a candle has a small body, a long upper shadow, and little to no lower shadow, this pattern is created. It is crucial to keep in mind that for this pattern to indicate a probable bullish reversal, it must develop near the end of a move or trend lower.
When understanding the inverted hammer pattern, traders should also take into account other market indicators, such as trend and important support and resistance levels.
9. Inverted Hammer
A falling trend is followed by the bullish reversal candlestick pattern known as the Inverted Hammer. A long upper wick and close opening and closing prices define it.
A potential trend reversal is also indicated by the Inverted Hammer, with the lengthy upper wick signaling buying pressure. A valid reversal signal must be supported by subsequent bullish price action on this pattern.
Inverted Hammer
10. Tweezer Bottom
At the bottom of a negative trend, a bullish reversal pattern called the Tweezer Bottom can be seen. It consists of two candles, the first of which is bearish and the second of which is bullish.
Both candles’ low points are in close proximity, signifying support. Bulls are attempting to seize control and push prices upward, and this pattern suggests that the trend may be changing. It is a typical pattern that may be applied to any time range.
It is crucial to keep in mind that the Tweezer Bottom pattern needs to be supported by further positive price action in order for the reversal signal to be genuine. In order to improve the signal’s dependability, traders often take into account other elements like volume and trend.
11. Three Outside Up
Three candles make up the Three Outside Up, a bullish reversal pattern that frequently follows a downward trend. A short bearish candle forms the initial one, which is then followed by a lengthy bullish candle that signals the presence of purchasing pressure. This pattern suggests a possible trend reversal and upward movement.
To correctly identify the candles, it’s crucial to pay attention to their size, shape, and placement in relation to one another.
Three designs of Outside Up. Additionally, to confirm the reversal signal, subsequent bullish price action is required. To increase the pattern’s dependability, traders also take other market factors like volume and mood into accoun
12. Bullish Counterattack
A two-candle pattern known as the Bullish Counterattack indicates the possibility of a bullish turn after a downward movement. A strong bullish candle that closes close to the high of the first candle follows the first long, bulky bearish candlestick patterns.
This pattern indicates the market has been entered by bulls who want to raise prices. It can be used by traders to perhaps profit from the ensuing bullish surge. It is vital to validate the Bullish Counterattack pattern with subsequent bullish price movement for a valid reversal signal. To improve the pattern’s dependability, additional market elements like volume and sentiment should also be taken into account. Traders can also combine the pattern with other technical analysis tools for a more complete strategy for trading with Candlestick patterns.
13. On-Neck Pattern
A bearish continuation pattern made up of two candles is called the On-Neck pattern. It implies that the declining trend might persist. Long bearish candle forms the first candle, which is followed by a short bullish candle that gaps down and closes quite near the close of the first candle. This creates a pattern for a horizontal neckline. This pattern indicates that bears are likely to keep the upper hand and push prices down.
Traders should focus on the size, shape, and placement of the candles in relation to one another in order to correctly recognize the On-Neck pattern. To strengthen the consistency of the pattern, it is also crucial to take into account additional market factors like volume and mood. For a more complete trading approach, traders can combine this pattern with additional technical analysis techniques. However, the pattern should be reinforced with follow-up negative price action for a legitimate continuation indication.
14. Dark Cloud Cover
A bearish reversal pattern that appears after an upward movement is the Dark Cloud Cover. A multi-candle pattern that indicates a potential shift from bullish to bearish is seen. Strongly bullish in the first candle, the second is bearish in the second, gapping above the first and closing below the first candle’s midpoint.
Traders typically place a short trade when the new candle opens after the pattern is complete. This trend suggests that the bears are gaining the upper hand and may lower prices.
The size, shape, and placement of the candles in relation to one another, as well as other market factors like volume and market emotion, should all be taken into account by traders to validate the Dark Cloud Cover pattern.
For a thorough trading strategy, combining this pattern with additional technical analysis tools can be beneficial. However, it’s crucial to remember that a single pattern does not guarantee a reversal, and traders should always wait for follow-up bearish price action for a reliable signal.
15. Hanging Man
The Hanging Man is a bearish reversal pattern that suggests that an upward trend may reverse. Look for a candle with a body towards the top, a lengthy lower shadow, and little to no higher wick to spot it.
This pattern develops following an upward movement and is employed to foretell a change in trend. To validate the signal, it’s crucial to wait for additional market factors and bearish price activity.
Hanging Man
16. Bearish Engulfing Bar
The Bearish Engulfing Pattern indicates a potential reversal of the negative trend. The Bullish Engulfing Pattern’s opposite is this pattern.
Check for a candlestick with a higher high and lower low than the preceding candle and a close toward the bottom, which indicates selling control, to confirm this pattern.
This pattern indicates that the bears are in control and may drive prices down.
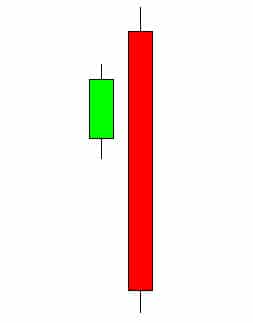
Bearish Engulfing Bar
17. Three Black Crows
The appearance of three black crows is a bearish pattern that suggests sellers are in charge, possibly indicating the beginning of a downward trend. Three consecutive bearish candles, each with little to no upper wick and each within the body of the previous candle, are needed to identify it.
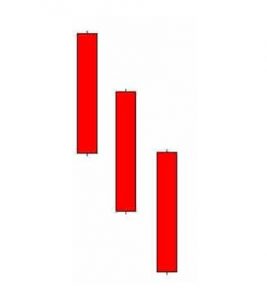
Three Black Crows
18. Black Marubozu
The opposite of the bullish Marubozu pattern is the bearish Marubozu pattern. One candle pattern like this one suggests a possible bearish reversal.
Look for a sizable, single bearish candle with little to no upper or lower shadow to identify it. This trend demonstrates that sellers controlled the session and drove prices lower.
19. The Evening Star
The evening star pattern is a bearish reversal indicator that could suggest the beginning of a downward trend after an ascending one has possibly ended.
It consists of three candles: a bullish first candle, a doji second candle, and a bearish third candle.
20. Three Inside Down
The three inside down pattern suggests that the market may be turning negative. It has three candles and is formed after a rise. The third candlestick, which confirms the reversal, is a huge bearish candlestick after the first two bearish candles. When this pattern is verified and a fresh candle opens, traders typically short trade.
21. Shooting Star
A potential shift in trend from bullish to bearish is indicated by the shooting star pattern, which is a bearish reversal indicator.
In order to detect a probable trend reversal during an upward trend, it is critical to spot this pattern, which develops after a price has been moving higher. The candlestick that makes up the shooting star pattern often has a little body toward the bottom of the candle and a long top shadow or wick that is much longer than the body.
Shooting Star
22. Bearish Harami
The bearish harami pattern is a type of candlestick that might show when market sentiment has changed from bullish to bearish. After a period of upward price movement, this pattern develops, indicating a likely reversal and move downward.
The pattern’s opening candle is a sizable bullish candle that symbolizes the prior bullish trend. However, the second candle is a minor bearish candle that appears within the first candle’s range, suggesting that purchasing pressure may have diminished and that the market’s sentiment may have changed.
Traders frequently hold off on entering a short trade until the next candle opens in order to confirm this pattern. With the help of this pattern, traders may make wise judgments and take advantage of market trends by gaining important insights into market sentiment and probable price moves.
23. Tweezer Top
A bearish reversal pattern called the tweezer top implies the conclusion of an upward trend and the possibility of a downward movement. This pattern is frequently used by traders as a chance to start short trades.
Two consecutive candles, the first of which is bullish and the second of which is bearish, produce this pattern. The similarity in height between the two candles, which signifies that a resistance level was met and that the bears have gained control and are pushing the price lower, is what distinguishes this pattern.
24. Bearish Counterattack
A potential shift from an upward trend to a downward trend in the market’s direction is indicated by the bearish counterattack pattern. The bearish counterattack is a bearish reversal pattern as opposed to the bullish counterattack, which is a positive reversal pattern. Typically, it appears after a price trend or upward movement.
Two candlesticks are the pattern’s distinguishing feature. The second candle gaps higher but closes lower, close to the close of the first candle. The first candle is a huge bullish candle with a small or nonexistent upper and lower wick. This pattern suggests that the bears are gaining the upper hand and may push the price lower. This pattern is frequently used by traders to start short positions in the market.
25. Doji
The conflict between buyers and sellers over the course of the price is reflected in the market’s key sign of hesitation, the Doji pattern. It develops a small body and longer wicks extending above and below it when the opening and closing prices are close to or equal.
The price remained largely stable throughout the trading day, indicating that neither the bulls nor the bears were able to acquire a clear advantage. Trading professionals may therefore read this as a signal that the trend may be about to change or that a time of consolidation is about to start.
The Doji pattern can be a strong signal when it comes during a trend, but its significance can change depending on the price action that came before it and the current market conditions. As a result, traders can assess the intensity and possibility of a prospective reversal using additional technical analysis and price action.
Doji
26. Three Outside Down
A likely trend reversal after an extended uptrend is indicated by the bearish three outside down pattern.
This pattern is created by three consecutive candles, the first of which is a little bullish candle, followed by a massive bearish candle that entirely engulfs the first candle’s body.
Another bearish candle, the third one closes at a lower price than the second. When a new candle confirms this pattern, traders frequently start short bets in expectation of a decline in price.
27. Spinning Top
Indecisiveness and uncertainty in the financial markets are frequently connected with the spinning top candlestick pattern. This pattern develops when a security’s price experiences both upward and downward movement but ultimately closes close to its initial price. Indicating that both buyers and sellers have tried to influence the market but have ultimately come to a standstill, this results in a modest candlestick body with upper and lower wicks.
The Doji pattern and the spinning top pattern are both indicators of market irrationality. In contrast to the Doji, which has a small body and longer upper and lower wicks, the spinning top pattern has a slightly bigger candlestick body. These patterns are frequently closely watched by traders and investors because they could indicate that a trend change or reversal is about to take place.
Spinning Top
28. Falling Three Methods
A bearish continuation pattern, the falling three-method pattern suggests that the downward trend might continue. Five candlesticks make up this pattern, and each one sheds light on how the market is acting.
The pattern’s first two massive candlesticks travel in the same downward direction as the general trend. The trend is temporarily broken by the next three smaller candles, which depict the bulls’ flimsy attempt to drive prices higher.
However, this effort is ineffective, and the trend keeps moving downward, reflecting the gloomy market attitude. This pattern alerts traders to the possibility of a further downward trend and the potential wisdom of entering short positions.
29. High Wave
The High Wave Candlestick Pattern is an indication of market uncertainty, showing that neither buyers nor sellers have been successful in taking control of the situation. This pattern frequently manifests itself in regions that are significant in terms of support or resistance levels.
Long upper and lower candle wicks with a little body that stays in the middle define the High Wave Pattern. This pattern shows that both the bulls and the bears had their moments of control throughout the trading session, but ultimately neither was able to establish supremacy. Because the market’s path is uncertain, this pattern acts as a warning to traders to proceed with caution before making any investment decisions.
30. Rising Three Methods
A five candlestick pattern called the rising three ways pattern denotes the continuance of an upward trend in the market. The falling three method pattern, which denotes the continuance of a downward trend, is this pattern’s opposite.
Three smaller bearish candles momentarily halted the upward trend, as evidenced by the pattern’s two massive bullish candles.
This shows that the bears tried to stop the trend by driving prices down, but they were unable to build up enough momentum to keep the trend going down. Given that the bulls continue to dominate the market, the pattern predicts that the upward trend will probably continue.
31. Downside Tasuki Gap
A bearish reversal pattern known as the downside Tasuki gap suggests that the downward trend may continue. The appearance of three candles defines this design.
Large bearish candlesticks that represent the first candle’s downward trend are present. The second candle is a sizeable bearish candle that spans lower than the first, highlighting the downward trend even more.
The third candle, a bullish candle, closes the gap left by the previous candle but is insufficient to revers the trend. Traders utilize this pattern, which develops during a negative trend, to predict future price decreases.
32. Mat Hold
The gap left by the bearish candles is filled in by a fourth huge bullish candle.
The mat hold pattern indicates that the move higher was briefly halted but is now appearing to resume. Traders trying to manage their open deals may find this pattern to be quite helpful.
In a similar manner, but the other way around, the bearish mat hold pattern develops. The price temporarily veers from its downward trajectory, but it soon resumes.
The trader can use this knowledge to enter or exit trades and control their risk exposure in both bullish and bearish mat hold patterns. These patterns have considerable potency and aid traders in tracking changes in the market.
33. Upside Tasuki Gap
An upward trend may continue, according to the bullish continuation pattern known as the upside Tasuki gap. It comprises of three candlesticks that suggest that the bullish trend may continue.
A massive bullish candle dominates the first candlestick, which is then followed by another bullish candle that opens above the preceding candle’s high and forms a gap. The gap left by the first two bullish candles is filled in by the third candle, which is bearish.
Using this pattern, traders have the chance to spot possible upward trend continuation and change their trades as necessary. The opposite of the downside Tasuki gap pattern, which denotes the possible continuation of a downward trend, is the upside Tasuki gap.
34. Rising Window
The rising window pattern, a bullish continuation pattern, suggests that the price will probably continue to rise.
This pattern is formed by two furiously bullish candlesticks. The second candle opens higher than the first candle’s closing, leaving a space between the two. This discrepancy shows that the security is in high demand and that the upward trend will continue. By noticing this pattern, traders can gain insight into potential market movement and make informed trading decisions.
35. Falling Window
A potential continuation of a negative trend is indicated by the bearish continuation pattern known as the falling window pattern. This pattern consists of two bearish candlesticks that break below one another to form a gap that shows the market is still under the sellers’ prolonged control.
This pattern gives traders the chance to spot situations where the downward trend might be about to pick up steam. One can choose wisely about their trading positions and profit from anticipated market movements by examining the features of this pattern.
Conclusion
Trading professionals can use candlestick patterns as a useful tool to understand market trends and make well-informed judgments. With 35 various patterns to choose from, traders have a variety of possibilities from which to pick the ones that are best suited to their own requirements. Candlestick patterns can be used in a variety of marketplaces and time spans due to their adaptability.
A trader just has to concentrate on understanding a few patterns that perform well for them; it is not necessary to have in-depth knowledge of all 35 patterns. Understanding the market’s price action context and where the pattern forms is essential for making effective use of these patterns.
In conclusion, candlestick patterns give traders with a wealth of knowledge and a useful and efficient technique to understand market trends. These patterns can be leveraged to make profitable trades if the right choice is made and the right information is understood.