")
Profitable traders are distinguished from their unsuccessful counterparts by a trio of traits: discipline, commitment, and skillful trading strategies. Long-term success requires all three components. Without discipline, even the best strategies will fail.
Without dedication and perseverance, traders are prone to give up on their transaction, particularly after suffering a loss, and they might even stop trading entirely. However, having a solid and competent trading plan that they can confidently execute is the most important quality for traders. In this post, we’ll look at some of the best trading techniques you may use to develop your own trading methodology.
Free PDF Guide : Get your The Art of Trading: Proven Strategies for Today’s Market
Table of Contents:
- The Optimal Trading Strategy: What is it?
- Fundamental vs Technical Analysis Strategies
- Expert Trading Strategies
- Top Indicators to Use
- Final Thoughts on Professional Trading Strategies
The Optimal Trading Strategy: What is it?
Unfortunately, there isn’t a one trading approach that works for everybody. The best trading approach differs from person to person and is influenced by a number of variables, including risk tolerance, timeframe for investments, and amount of market activity.
Your trading strategies, which are governed by a number of elements, are heavily determined by your risk appetite. While older investors are more risk-averse, younger investors typically take more chances. Smaller companies with tremendous growth potential may appeal to investors with a higher risk tolerance. On the other hand, risk-averse investors like trading blue-chip companies, which provide consistency and reliable returns despite their lower rates.
The types of investments you make and the trading tactics you employ are greatly influenced by your investment timeframe. While long-term investors may concentrate on profit timelines stretching up to 10 years or more, short-term traders may employ tactics that require examining 5-second candles.
Your adoption of strategies is also influenced by how active you are in the market. Active trading entails frequently buying and selling shares in order to profit from price changes, whereas passive investing entails purchasing a specific portfolio of shares and receiving regular dividend payments for keeping the stock. Depending on whether they are active or passive traders, different techniques are suitable for various sorts of investors.
The two main categories of trading methods are fundamental analysis and technical analysis, and each is appropriate for certain sorts of investors. To get the best outcomes, some traders combine the two approaches. We will talk about numerous trading techniques in this article, along with the kinds of investors that each approach works well for.
Fundamental vs Technical Analysis Strategies
Their targeted results are the main distinction between technical and fundamental analysis. While both have the same goal of identifying businesses to invest in, their methods and outcomes differ. We will go over each strategy’s benefits and downsides in more detail below.
To find companies with robust and durable business models, fundamental analysis examines a company’s core values. Investors then make investments in these businesses with the hope of making money as they expand and become more successful. This long-term plan takes into account the company’s financial standing, sector competition, and the state of the economy as a whole. It necessitates a significant amount of qualitative study and offers more thorough and trustworthy indicators. It can, however, be very mathematically challenging and skill-intensive. It is also a long-term approach that cannot predict the best times to enter and exit trades and can not offer big short-term gains. It can only identify undervalued equities.
For long-term investors with various risk tolerances who benefit from dividends and long-term share price appreciation, fundamental research is largely appropriate.
Technical analysis, on the other hand, differs since it frequently has little to do with the business whose shares are being traded. Traders are simply concerned with price swings and are not concerned with the company’s fundamentals; instead, they try to profit from changes in price levels in the market. Their time horizon is shorter than that of fundamental traders, and depending on their holdings in the company, they can make money whether the price of a share rises or falls. Technical analysis is more versatile and adaptive to various times and instruments because it only requires traders to look at a small dataset. However, it is prone to a greater degree of subjectivity and is predicated on the idea that past behavior can anticipate future tendencies, which does not always work.
Technical analysis is best suited for active traders who have access to reliable trading data and are prepared to invest the time necessary to trade and continuously get better.
Expert Trading Strategies
Depending on the kind of analysis you want to do, you can choose from a variety of professional trading techniques. Here, we go into great detail about four of the most popular trading methods.
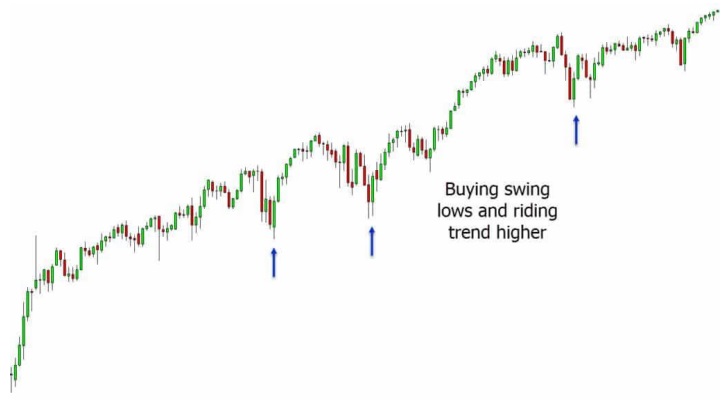
Technical analysis is primarily used in swing trading to take advantage of profits made over the course of a few days or weeks. This is a short- to medium-term approach, and for larger transactions, traders may also apply fundamental analysis. Since traders hold open positions over the weekend and overnight, this poses a significant danger.
The trading strategy known as “scalping” doesn’t use either technical or fundamental analysis. Scalpers make little profits on each of the hundreds of deals they open and close each day. The essential thing to think about is having a solid exit strategy for every trade to prevent big losses.
Day trading concentrates on initiating and terminating trades inside the same day while using a variety of strategies and techniques to spot lucrative chances. In addition to trading on corporate announcements, earnings reports, and other fundamental variables, day traders also frequently rely on technical analysis.
Positional trading is the antithesis of day trading because it has a very long time horizon, frequently exceeding a year. Position traders take positions and maintain them until they make the anticipated profit. They are “trend followers.” They employ both fundamental and technical analysis, with the former helping them pick stable companies and the latter allowing them to discern trends and the best entry and exit points.
In conclusion, understanding and selecting the right trading strategy depends on the type of analysis you intend to employ, your level of risk tolerance, your schedule for making investments, and the market activity. Understanding the benefits and drawbacks of each trading technique will help you become a better trader.
Top Indicators to Use
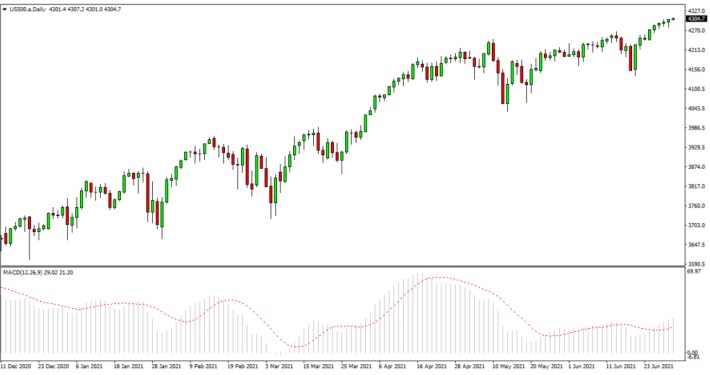
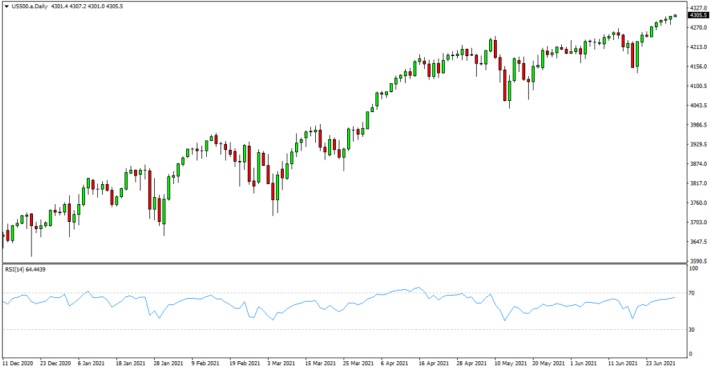
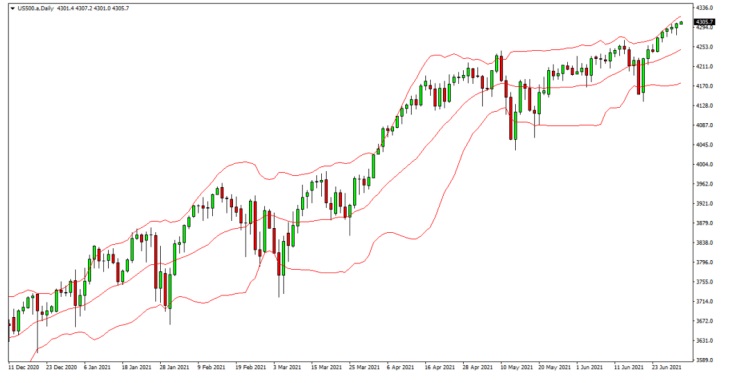
In addition to fundamental and technical analysis, traders frequently employ statistical indicators to find trading opportunities and validate their theories about a company. Despite the large number of indicators available, traders often choose 2-3 that suit them the best through practice and experience. The Moving Average Convergence Divergence (MACD), Relative Strength Index (RSI), and Bollinger Bands are a few frequently utilized indicators.

The MACD uses two lines, the MACD and signal lines, to show the trend and momentum direction of a stock. The MACD line crosses above the signal line to signal a bullish trend, while the MACD line crosses below the signal line to show a negative trend.
The RSI, which ranges from 0 to 100, measures a stock’s market momentum and sentiment. A stock is oversold and may be about to reverse when the RSI drops below 30, whereas a stock is overbought when the RSI rises above 70. Additionally, the stock’s support and resistance levels are determined using these levels.
When determining whether a stock is overbought or oversold, Bollinger Bands look at its closing prices over a specific time frame. Simple Moving Average (SMA) serves as the central line in Bollinger Bands, and the SMA and stock’s standard deviation are used to determine the upper and lower bands. The stock price is regarded as overbought when it crosses over the top band, and oversold when it goes below the lower band.
Final Thoughts on Professional Trading Strategies
Every trader has their own distinctive trading style, which they create through time, but it all starts with gaining the necessary theoretical understanding to trade the markets. You must develop and hone your methods in order to respond to shifting market conditions after identifying your risk tolerance, timetable, and preferred style of trading.
The trading tactics covered in this article can be used as a strong foundation for creating your own profitable and disciplined trading style. You may join the exclusive club of traders who consistently make money in the markets over the long term with effort, practice, and time.