
There are many trading techniques that can be used to support one’s trading career in the area of technical analysis. While some of these tactics are fairly recent, others have been in use for many years. The trading strategy created by Richard Wyckoff over a century ago will be discussed in this piece. The Wyckoff theory, Wyckoff trading strategy, and Wyckoff trading tools will all be covered in detail. American stock market trader Richard Wyckoff, who was born in the late 1800s, changed technical analysis by developing a trading method that is still used today. The Wyckoff method uses market trends and larger institutional investors’ actions to forecast market trends and help technical analysts identify the best entry points and risk management strategies. Although Wyckoff’s strategy can be applied to other markets where major institutions can freely trade, such as forex, commodities, and cryptocurrencies, it is primarily focused in this article on the stock market.
Free PDF Guide : Get your The Origins and Principles of the Wyckoff Trading Method
Table of Contents:
- Wyckoff Theory
- Wyckoff Pattern
- What is the Wyckoff Trading Method?
- Wyckoff Accumulation Pattern
- Wyckoff Trading Software
- Lastly
Wyckoff Theory
According to Wyckoff, every market change has an equal and proportionate impact to its underlying cause. For instance, a stock’s worth will increase if it is accumulating and decrease if it is distributing. The law of cause and effect, which states that every action will have a corresponding response, is the most crucial of the three laws upon which this theory is predicated. Wyckoff came to the conclusion that every market movement has an equal and proportionate effect to its cause by applying this rule to the financial markets.
The second tenet supporting Wyckoff’s thesis is the law of supply and demand. It is essential to his approach to trading and investing, which is based on the fundamental principles that prices will rise when demand outpaces supply and decline when supply outpaces demand. Traders must analyze price and volume bars over time to comprehend supply and demand, which requires a lot of practice to master.
The law of effort verses result is the third tenet of Wyckoff’s theory. He believed that major price changes should happen as a result of high volume trading during a specific time. Wyckoff developed a heuristic tool known as “the composite man” to assist traders in understanding changes in stock prices. He explained that all market changes should be investigated as though they were the outcome of the Composite Man’s actions. Traders can make money and prevent loses in the market by comprehending how this “man” conducts himself.
Wyckoff Pattern
Four essential components make up the Wyckoff pattern: trend identification, reversal patterns, price forecasts, and trend position. Since most stocks tend to move in the same direction as the market, correctly predicting the market’s direction is essential for trading this pattern effectively. Therefore, in order to use Wyckoff’s methodology, determining the pattern is crucial.
Once the trend has been found, the length of the trend can be calculated and targets for when a reversal is anticipated can be set using a horizontal chart method. The traders can establish profit-taking targets with good risk/reward ratios using these price projections.
What is the Wyckoff Trading Method?
According to Wyckoff’s hypothesis, there are five steps to finding stocks and entry points. The following stages must be followed by traders in order to use this methodology for trading:
- Determine whether the market is consolidating or trending in order to project a future pattern. The most probable future direction of the market can be predicted using technical analysis techniques.
- Find securities that fit the anticipated pattern. If you think an uptrend is imminent, invest in companies that outperform the market during rallies and are less affected by negative reactions. If you expect a downtrend, on the other hand, take the contrary action.
- Find securities that have a “cause” that fulfills or exceeds your minimum objectives in step three. In this stage, price targets are determined using Point & Figure (P&F) projections for long and short trades.
- Determine whether the securities are prepared to move by using technical analysis indicators to assess a stock’s preparedness.
- Time your action to coincide with a change in the stock market indicator. Since most individual stocks move in lockstep with the market as a whole, traders can increase their chances of a profitable transaction by harnessing the power of the market as a whole.
Wyckoff Accumulation Pattern
After a major downtrend, the accumulation phase, which is characterized by range-bound trading, starts. Institutional investors want to increase their holdings while scaring retail traders away from their stocks to avoid further price declines or the emergence of new trends. Because they continue in this phase until they have accumulated enough shares to achieve their goals, this phase is known as a “accumulation pattern.” According to Wyckoff’s theory, the accumulation phase has six key components, which we will go over in more depth below.
The price spread widens and there is noticeable buying volume at the initial support level, which suggests that the downtrend is likely to end shortly. The second stage is the selling climax, when selling volume hits an all-time high and significant amounts of retail traders’ sales are bought at a loss by institutional investors.
The third stage of the accumulation phase, known as the automatic rally, is brought on by a drop in selling volume and is characterized by a surge in buying volume that easily raises the price. The price revisits its lowest points during the second test, which comes after the automatic recovery, to gauge how well supply and demand are balanced. Following the second test, “the test” or “the spring” starts, during which big investors look for supply at critical junctures during a price advance.
An obvious change in price action and the points at which the price starts to recover previously established micro-structural pivot points can be seen at signs of strength, the final level of support, and the “back-up.” A price increase with wider spread and noticeably higher volume that usually takes place after a spring is known as a sign of strength (SOS). The lowest pullback position following a sign of strength is known as the last point of support (LPS). The “back-up” serves as a test for additional supply near the region of resistance and symbolizes temporary profit-taking.
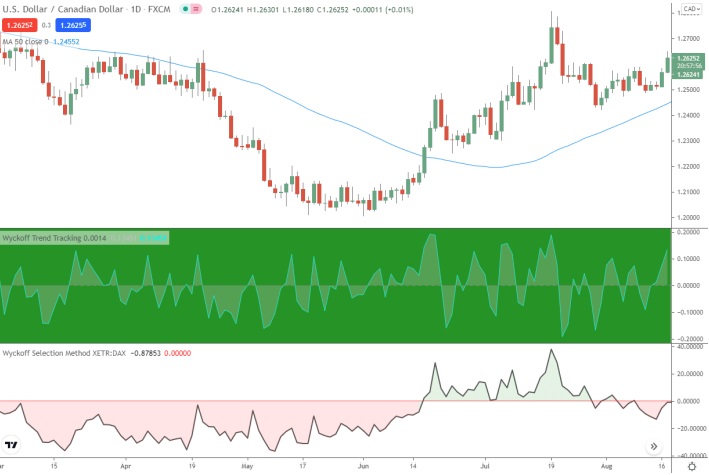
Wyckoff Trading Software
Technology advancements have resulted in the creation of software that can help traders execute Wyckoff’s trading methodology. Traders have access to a variety of signs, most of which are cost-free. Through online charting tools like Trading View, it is simple to obtain these indicators. Some of these indicators can be found in the link given here.
Lastly
Early in the 20th century, Wyckoff developed an innovative trading strategy that was largely predicated on the idea that institutional investors could manipulate stock prices to their advantage and thus influence stock price patterns. Ironically, given his intention to inform the general public about the operation of the financial markets, his methodology has not been extensively embraced by retail traders despite the popularity of his techniques among professional traders. But Wyckoff’s methods for picking stocks and making investments have endured the weight of time.
Trading decisions can be made using Wyckoff’s technique that are well-informed and unaffected by emotions. This method calls for concentration and prevents traders from getting stuck on the wrong side of a transaction, enabling them to invest in stocks by taking advantage of big institutional investors.