
The fundamental tenet of technical analysis is that price follows momentum. Yet, market prices rarely move in a straight line, which occasionally causes momentum to deviate from the price. This circumstance is referred to as a divergence in technical analysis, and traders might profit from it by exploiting price discrepancies. In both bullish and bearish markets, divergences are essential tools for investors to spot signs of trend reversals. This in-depth trading manual around divergence cheat sheet offers a thorough analysis of divergence, covering its definition, several kinds of divergences, and the best ways to trade it.
Free PDF Guide : Get your Mastering Divergence: Your Ultimate Divergence Cheat Sheet PDF
Table of contents
- Definition of Divergence
- The Mechanics of Divergence
- Regular Divergence Explained
- Hidden Bullish Divergence Demystified
- Hidden Bearish Divergence Unveiled
- Divergence Indicators: An Overview
- Exploring Divergence RSI
- Bullish Divergence RSI: How it Works
- Bearish Divergence RSI: How it Works
- Conclusion
Definition of Divergence
When an asset’s price changes in the opposite direction from the associated indicator being employed, this is known as a divergence in trading. A divergence signal appears when the price of the asset and the indicator it is linked to are no longer in synchrony. When markets are functioning normally, an asset’s price action and technical indicators both move in the same direction. In other words, if the asset’s price reaches a new high, the technical indicator ought to do the same. Likewise, the technical indicator need to change when the price makes a new bottom. Yet, a divergence appears when this convergence shifts out of alignment.
When the price increases while the indicator decreases or vice versa, this is an illustration of a divergence signal.
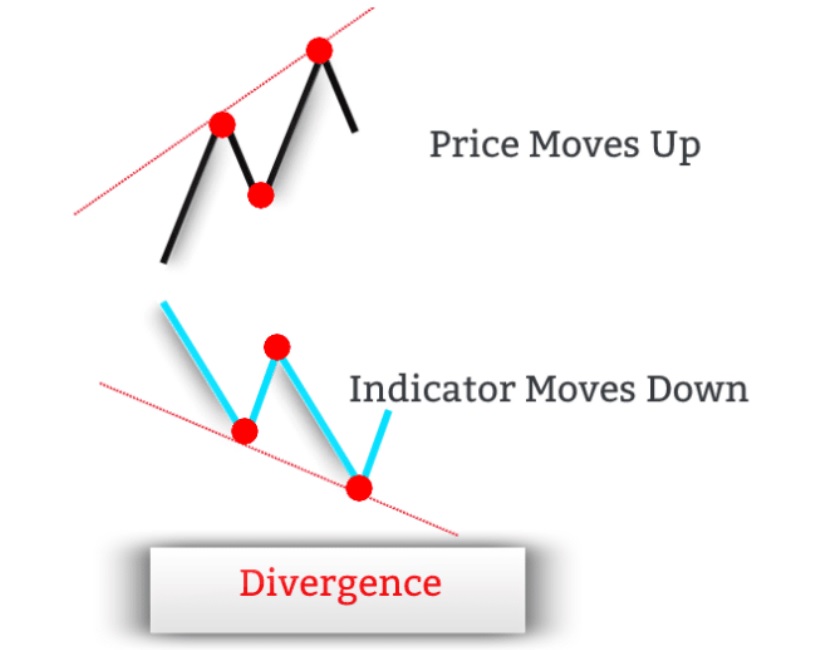
Divergence is a trading idea rather than, technically, an indicator. Divergence is calculated visually on the price chart rather than with a precise mathematical calculation. Divergence’s main job is to tell when a trend’s momentum is increasing and to send out early warning signals when the momentum readings start to decline. Divergence acts as a forewarning that a price reversal may be imminent but does not foretell when it will happen. Contrarily, convergence happens when the price of the asset and the accompanying indicator move simultaneously in the same direction. For instance, the indicator should follow the price and publish a corresponding higher low when the asset’s price creates a new higher low.
The Mechanics of Divergence
Trading requires a solid comprehension of the fundamental concepts that drive a market’s price movements. In essence, asset values move in a pattern of higher highs and higher lows during an uptrend, whereas lower lows and lower highs characterize a downtrend. Buying when the price hits a new low and selling when it reaches a new high are the two key components of successful trading. Divergence can help traders determine whether it makes sense to purchase at a new low or sell at a new high. Analyzing the disparity between price and technical indicator signals is necessary for this. Divergence has a disadvantage in that it might not offer timely trade signals because the signal might remain even while the price doesn’t change direction. Regular divergence, sometimes referred to as classic divergence, and concealed divergence are the two different types of divergence signals. The many types of divergence and the signals they generate are listed in the table below.
| Price | Oscillator | Divergence Type | Signal |
|---|---|---|---|
| High – Higher High | High – Lower High | Regular Bearish Divergence | Sell |
| Low – Lower Low | Low – Higher Low | Regular Bullish Divergence | Buy |
| High – Lower High | High – Higher High | Hidden Bearish Divergence | Sell |
| Low – Higher Low | Low – Lower Low | Hidden Bullish Divergence | Buy |
Regular Divergence Explained
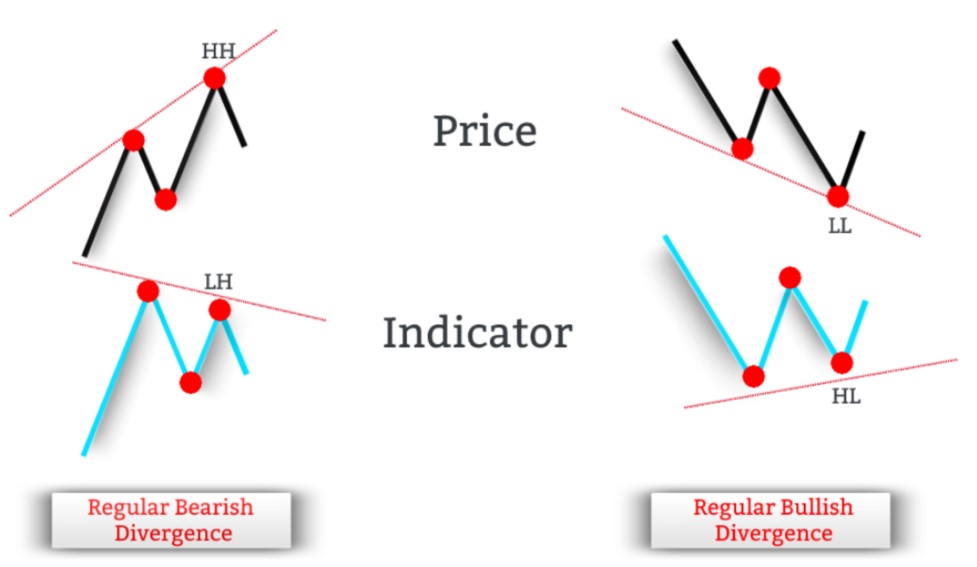
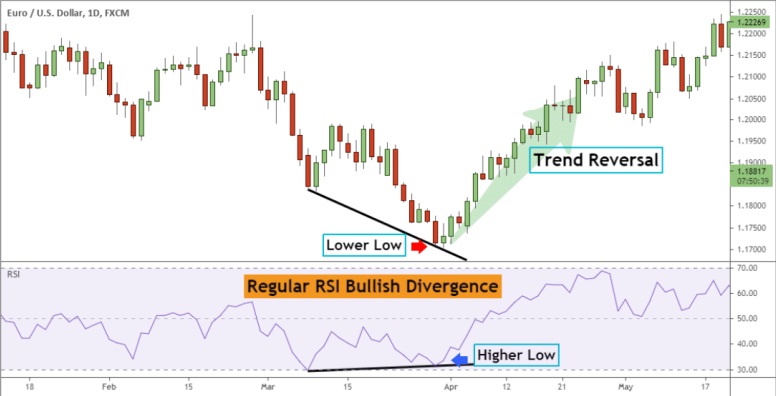
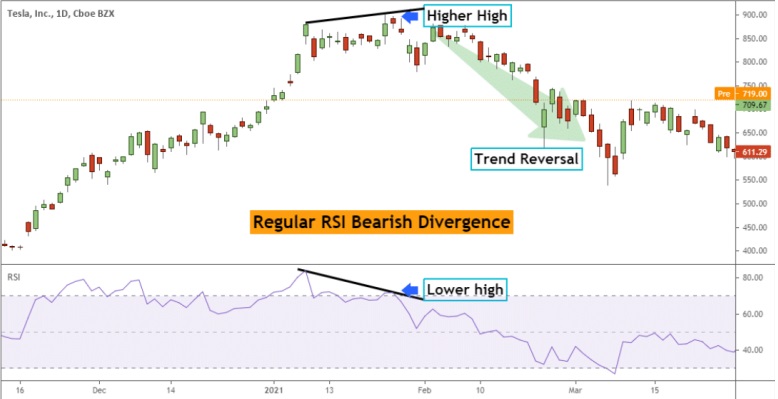
Regular bullish divergences and regular bearish divergences are the two categories under which regular divergences fall. When the price is falling and making lower lows while the RSI indicator is rising and making higher lows, there is a regular bullish divergence RSI. Regular bearish divergence, on the other hand, occurs when the technical indicator is declining and making lower highs while the price is rising and making higher highs. Frequent bullish divergence is a buy signal since it is an early hint that the current downturn will shortly reverse and transition to an uptrend. On the other hand, consistent bearish divergence is a sell signal since it signals that the current uptrend is ready to change course and transition to a downturn. The difference between regular bullish and regular bearish divergence is seen side-by-side in the accompanying image.
It is ideal for the bullish divergence to occur near the conclusion of a downturn because it usually does, and this will cause a natural change to an uptrend. A regular bearish divergence, on the other hand, usually happens at the end of an upswing, creating the perfect environment for the divergence to form and eventually triggering a natural change towards a downtrend.
Hidden Bullish Divergence Demystified
Similar to ordinary divergence, hidden divergence calls for a difference between the price and technical indicator. Hidden divergence, on the other hand, indicates the probability of trend continuation whereas normal divergence indicates a probable trend reversal. Typically, hidden divergences appear within an existing trend and indicate that the trend is still strong enough to continue. Hidden bullish divergence and hidden bearish divergence are the two types of hidden divergence. When the price makes a higher low and the related indicator makes a lower low, there is a hidden positive divergence. This form of divergence is seen as a buy signal and is an early sign that the current uptrend is likely to continue, usually following a price correction. The comparison between hidden bullish divergence and hidden bearish divergence is shown in the accompanying graphic.
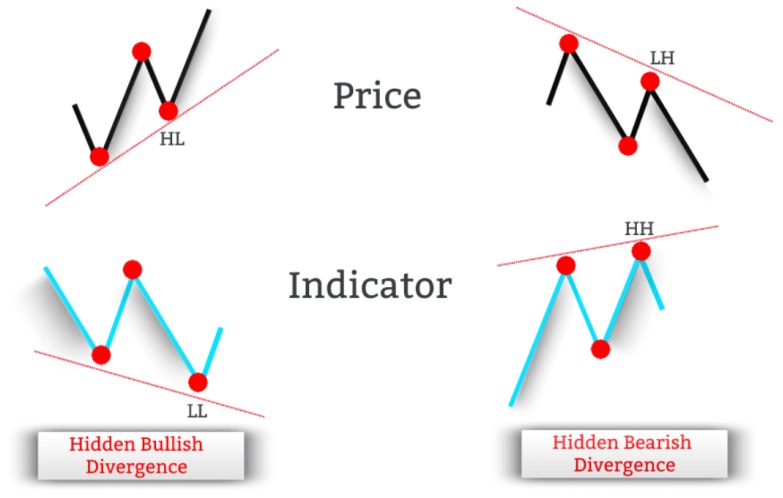
In uptrends, hidden bullish divergence is frequently seen.
Hidden Bearish Divergence Unveiled
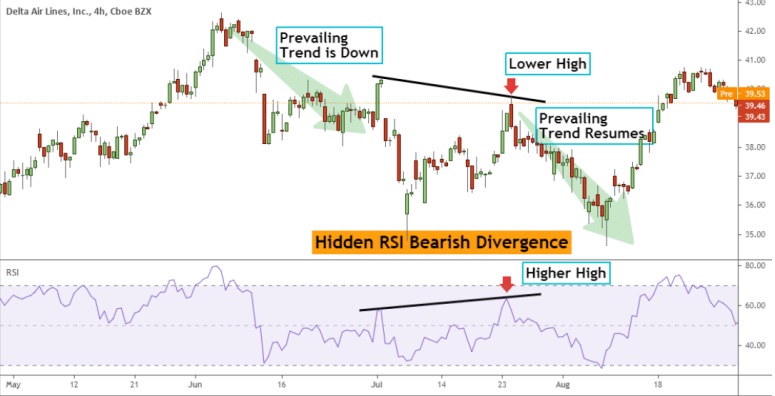
When the price is making a lower high and the accompanying indicator is making a higher high, there is a hidden bearish divergence. This kind of divergence is a precursor to the likelihood that the current decline will persist. During a price retracement, hidden bearish divergence signs frequently appear. These signals are interpreted as sell signals because they show that the bears are poised to take back control of the market. Downtrends frequently show hidden bearish divergences.
Despite being less frequent than regular divergences, hidden divergences can be useful to traders since they give a head start on when the current trend is expected to return. Hidden divergences occur concurrently with brief market retracements and suggest that a downturn may be coming to a conclusion. A pullback in a downtrend ends when there is a secret bearish divergence, and a pullback in an uptrend ends when there is a hidden bullish divergence.
Divergence Indicators: An Overview
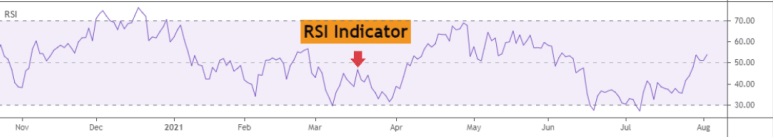
Traders must first select a technical indicator in order to recognize probable trend reversal or trend continuation signals through regular and concealed divergence. Momentum oscillators like the RSI, Stochastic, and MACD are frequently used by retail traders to spot occasions where the price of an asset and the indicator do not converge. Technical indicators can be used in a separate window or right on the price chart. According to this MACD divergence cheat sheet, regular divergence is best detected using the MACD, Stochastic, and RSI, while concealed divergence is best detected using the Money Flow Index (MFI), which is a trend-following indicator. The RSI is one of the most often used technical indicators for identifying both obvious and concealed divergence. Peaks and valleys created by an asset’s price correspond to corresponding peaks and valleys in technical indicators.
Exploring Divergence RSI
The Relative Strength Index (RSI) is a leading technical indicator that can presage market movements, making RSI divergence a leading signal of price action. Traders can use the RSI indicator to discover both regular and hidden divergences. Therefore, as per this RSI divergence cheat sheet, RSI divergences cannot be employed as a timing tool. To confirm the resumption of the prevailing trend (in the event of RSI hidden divergence) or trend reversal (in the case of RSI regular divergence), traders can employ candlestick chart patterns as a wonderful confirmation indicator. When traders observe regular RSI bullish divergence or hidden RSI bullish divergence, they can seek for long positions, whereas regular RSI bearish divergence or hidden RSI bearish divergence can imply a sell position.
Bullish Divergence RSI: How it Works
The chart below shows a typical bullish RSI divergence. In this instance, traders can see that the price is making a new lower low on the price chart relative to the prior swing low point. The RSI indicator is printing a higher low in relation to the prior low on the RSI oscillator at the same time. After the development of the lower low on the price chart, the trend turned from being bearish to being positive.
The RSI indicator can also be used by traders to spot bullish hidden divergences. The example that follows shows a price trending upward. A hidden bullish divergence is developing on the price chart by comparing the swing lows on the price with the swing lows displayed on the RSI oscillator. The dominant trend continues and hits new highs after producing the upper low on the price chart. It is crucial to remember that, provided all the technical criteria are satisfied, the bullish hidden divergence might appear at any time throughout the upswing.
Bearish Divergence RSI: How it Works
The price hits higher highs as the RSI oscillator hits lower highs in a typical bearish RSI divergence. In the example below, traders can see how the price establishes a new, higher high on the price chart compared to the prior swing high point. The RSI oscillator’s prior high is printed on the RSI indicator, however the RSI indicator prints a lower high in comparison. The price begins to quickly reverse after the RSI bearish divergence, and a new trend starts to take shape.
Similarly, the RSI indicator can assist traders in finding concealed divergences that are bearish. The example that follows shows how prices are trading in a downward trend. A hidden bearish divergence is developing on the price chart by comparing the swing highs in the price to the swing highs displayed on the RSI oscillator. The bearish trend moves downward after the concealed bearish divergence.
Lastly
In conclusion, traders should be aware that although concealed divergence implies a trend continuation, regular divergence indicates a trend reversal. Trend-following traders should concentrate on spotting concealed divergence because it enables them to follow the market trend. Due to the fact that it indicates trend continuation, hidden divergence is more effective than conventional divergence. It’s vital to remember that trading divergence works in all time frames, but that the signal is more trustworthy the higher the time frame.