All price data, from past prices to current prices, are recorded and observed on price charts.
It is likely that you have seen a price chart, whether through an active interest in trading or just casually looking at a stock.
It is from the data recorded on these price charts that we look for the patterns that help us identify trading opportunities. A pattern is nothing more than a recognizable configuration of price movement, and it is the basis for what we call technical analysis.
Technical analysts interpret these patterns to predict future price movements. The background on using technical analysis can be found in human psychology and herd behavior.
In this section we will analyze the ABCD pattern. We will discuss how and when to use this pattern, its variations, and useful indicators you can use when trading this pattern.
What is the ABCD Pattern?
The ABCD pattern is among the most popular and one of the easiest patterns to identify. There are four parts to this pattern, identified as A, B, C, and D.
The pattern indicates when the price of a security is about to change direction and begin trending in the opposite direction. If a stock has been trending upward, the ABCD pattern will help you predict when this trend will reverse to the downside and vice versa.
The ABCD pattern can indicate either bullish or bearish reversals. Below is an example of an ABCD pattern.
How to Use the ABCD Pattern
If you are able to predict when a trend reversal will occur, you can use that information to help boost your profits. Let’s examine some ABCD patterns to learn how to spot its formation.
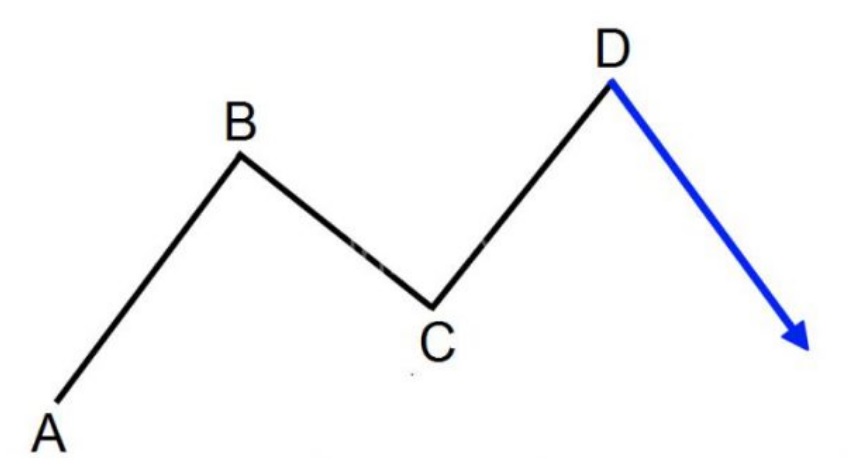
First, let’s look at a bearish ABCD pattern. This would occur when a stock has been trending upward and reverses to the downside. If you can correctly identify a bearish ABCD pattern, you would have a good entry for a short position.
In a bearish ABCD pattern, you would be looking for the price to initially be on the rise (A) to a new high of the day (B). At the high, it will dip down to a support level ( C). The support (C) should be higher than the initial point (A). Once support has been established at (C), prepare for an entry if the price begins to rise from its support at (C) up to a new high (D). Once the price reaches (D),if the pattern holds, the trend will reverse at (D), and you enter the short position.
Take a look at the visual example of an ABCD Bearish Pattern.
Once you have located an entry position (near D), you should know what your target exit point will be.
Recall in a previous section we discussed risk:reward ratios. This mindset holds for any trade. It depends on your comfort level, but as a general rule, your exit target should be two or three times as much as your risk. Therefore, if you enter a $100 position and have a stop-loss order at $90, your sell order should be at $120 for 2:1 and $1300 at 3:1. You stand to profit 20-30% while risking 10% on the trade.
Bullish ABCD Pattern
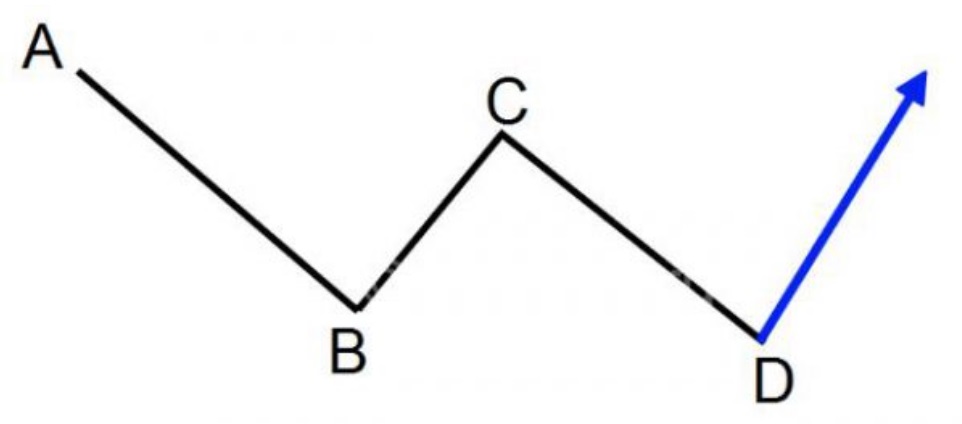
The bullish ABCD pattern begins with a move downwards. This indicates selling so there will be a decrease in the security price. This is our (A). As people buy the dip in price, there will be a bottom and reversal, which is (B). After this rise in price, selling volume will again increase, sending the pricelower until it finds a support level lower than (A). The support level formed is (C). After this fall in price, the trend needs to reverse and begin the uptrend (D).
Below is an illustration of an ABCD bullish pattern.
XABCD Pattern
XABCD patterns are similar trend reversals to the original ABCD pattern, and they can form a bullish or bearish pattern.
There are several XABCD patterns, but the four most popular are:
- Gartley.
- Butterfly.
- Crab.
- Bat.
They are made up of five-point chart patterns and may be more difficult to locate because they consist of various measurements and ratios. If you are interested in trading these, there are some online tools available to help you identify these patterns more easily.
ABCD Pattern Indicator MT4
If you do not have quality MT4 / MT5 charts to use these indicators, you can learn how to get the best free trading charts and which broker to use these indicators with here.
For traders using the MT4 platform, custom ABCD pattern indicators built into the platform can help identify these patterns more easily. A link to download the ABCD pattern indicator can be found below.
This indicator is a premium indicator and there is a cost associated with it. Current price, at the time of writing, is $99.
Read more about the ABCD indicator for MT4 here.
ABCD Pattern Indicator MT5
Like the MT4 platform, MT5 also has its own custom ABCD indicator available to download
This is also a premium indicator and can be downloaded from the link below for $99.
Read more about the ABCD indicator for MT5 here.
Important: If you need help installing and/or using these indicators, read How to Download, Install and Use MT4 and MT5 Indicators.
Conclusion
Chart patterns are an effective tool to provide traders with a statistical advantage, but nothing offers a guarantee of a successful trade.
Like with any investment, past performance is not indicative of future results.
Price movements, unexpected news, etc. cause deviations from trading patterns, and the price may behave differently than expected. Traders should always monitor all trades closely and effectively manage their risk.
Related Projects

Fundamental Analysis In Forex
Accounting / Financial
Andrews Pitchfork
Accounting / Financial
Forex Math
Accounting / Financial