
The Moving Average, a key tool in technical analysis, is one of many technical indicators that are frequently used. By examining historical pricing, volume, and future contract data, these indicators help traders predict market patterns. As a trader, you probably look for the most trustworthy and common indicators to guide your trading selections, and the Moving Average is one of the best.
Free PDF Guide : Get your Moving Averages Trading Strategies for Stocks and Forex Markets
Table of Contents:
- Overview of Moving Averages
- Simple Moving Average (SMA) Explained
- Understanding Exponential Moving Average (EMA)
- Application of Moving Averages in Different Markets
- Popular Moving Average Combinations
- The 200-Day Moving Average
- The 50-Day Moving Average
- 200 EMA Multi-Timeframe
- Moving Average Crossover Techniques
- How to Effectively Use Moving Averages in Trading
- Analyzing Trends with Moving Averages
- Identifying Support and Resistance with Moving Averages
- Summary of Key Points
Overview of Moving Averages
Moving Averages are often used by traders on their price charts because they can accurately track and identify market trends by reducing variations. A technical indicator called a moving average can help you examine price activity, spot the market’s dominating trend, and provide dynamic support and resistance levels as prices change. In essence, a moving average shows the average price over a given time frame and adapts when prices change. Any sequential data sets, such as opening and closing prices, high and low prices, trading volume, or other indicators, can be applied to it. Simple Moving Average (SMA) and Exponential Moving Average are the two most used types of moving averages (EMA).
Simple Moving Average (SMA) Explained
The simplest straightforward type of moving average is the Simple Moving Average (SMA), which gives it its name. It can be calculated easily by dividing the total price over a certain number of periods by that same number of periods. For instance, a 10-day SMA would add up the most recent ten days’ closing prices and divide the total by 10. Every time a new period starts, the moving average advances, dropping the oldest data point and including the most recent one. Based on Apple’s closing prices, consider the 6-day SMA calculation example that follows:
43.41, 43.52, 43.21, 43.77, 43.58, 43.63 = 261.12
To calculate the SMA, divide the sum of closing prices by the number of periods:
6-day SMA= 261.12/6 = 43.52
Understanding Exponential Moving Average (EMA)
As a technical indicator, the Exponential Moving Average (EMA) is the second most used by traders. By adding a portion of today’s closing price to the prior moving average, it gives more weight to more recent prices. SMAs treat all data equally, whereas EMAs give recent market movements more weight, enabling them to respond more quickly to price changes. This is the main distinction between the two types of indicators. An SMA is utilized as the EMA for the initial calculation to begin an EMA. The EMA should then be computed for each day between the initial EMA value and the current date, after which the weighting multiplier should be determined. For illustration, the 10-day EMA formula might be as follows:
Initial SMA: 10-period sum/10
Multiplier: (2 / (Time Periods + 1)) = (2 / (10 + 1)) = 0.1818 (18.18%)
EMA: {Close — EMA (Previous Day)} x Multiplier + EMA (Previous Day)
Application of Moving Averages in Different Markets
Due to the enormous number of market participants, the liquidity of the Forex market is strong, whereas the liquidity of equities outside of blue-chip stocks may be lower. By reducing daily price swings on all financial markets, moving averages give analysts a tool to examine market data. The chart time frame and the trader’s time horizon determine the length of the moving average that is applied. The “look back time” selection can also influence how well the moving average performs. Because to their focus on current prices, EMAs may be more effective depending on the market and situation, but SMAs may be more effective in other circumstances.
Popular Moving Average Combinations
The 200-Day Moving Average
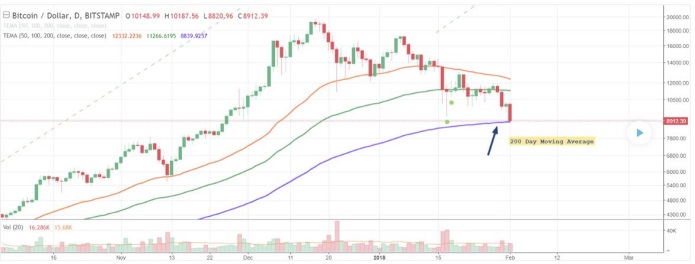
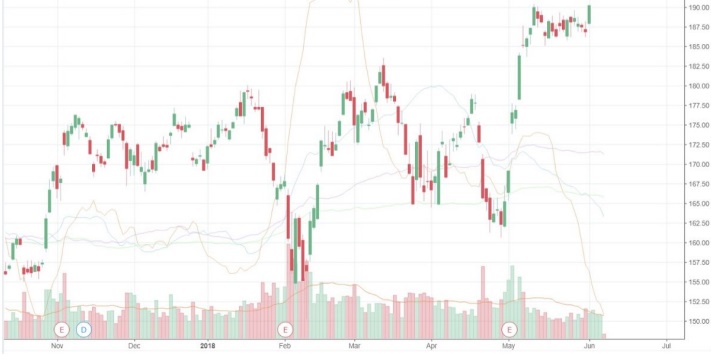
A very well-liked technical signal among investors, hedge funds, and market makers is the 200-Day Moving Average. It is frequently regarded as an essential instrument for determining a security’s long-term trend. The average closing price of an asset over the previous 200 days is used by traders and investors to examine price trends. The closing prices for the previous 200 days would be added up, and the sum would then be divided by 200 to determine the 200-day moving average.
The 50-Day Moving Average
Another popular technical indicator used by investors to forecast and track market patterns is the 50-Day Moving Average.
It is favored because of how well it analyzes markets. The average closing price of a securities is determined over the previous 50 days by adding the closing prices of each day and dividing the total by 50.
The 50-day moving average is calculated using the formula below:
[(Day 1 + Day 2 + Day 3 + Day 4 + Day 5 + … + Day 48 + Day 49 + Day 50) / 50] = 50-day moving average
200 EMA Multi-Timeframe
A very well-liked forex indicator is the 200 EMA since it may show the current trend before opening a position. There are crucial aspects you must comprehend in order to use this instrument effectively. To distinguish between bull and bear market circumstances, we use the 200 EMA. It is crucial to be aware of:
- Price movement below the 200 EMA typically indicates a downward trend.
- Price moving higher than the 200 EMA often indicates an uptrend.
- Price action should be utilized in conjunction with price action charts to decide where to set stop orders and where to take profits in order to enter trades effectively.
Here is an example of how you might use the 200 EMA:
- In your daily chart, plot a 200 EMA to identify if the trend is upward or downward.
- Then, change to the 4-hour chart and check to see if the 200 EMA is still following the same trend as the daily chart or where it stands in regard to price movement.
- If the answer is true, turn to the 1-hour chart and make sure it exhibits the same pattern as your daily and 4-hour charts.
- After the trend on this chart lines up with your 4-hour and daily charts, you can start placing trade entries on the 1-hour chart.
Moving Average Crossover Techniques
Due to their simplicity and lack of emotion, crossovers are the most common sort of indication among traders. They can help in the development of entry and exit strategies and are used to identify momentum shifts. When two moving averages cross each other, a moving average crossover occurs. Crossovers can be used to spot trends, but they cannot forecast future changes in the market.
A slower-moving average and a faster-moving average are typically used by this indicator, which may also use two or more moving averages. Since it takes into account a shorter time period, the shorter moving average is known as a short-term moving average and is more responsive to daily price movements.
How to Effectively Use Moving Averages in Trading
Moving averages are typically used to identify trends and reversals, pinpoint levels of support and resistance, and assess the momentum of an asset. They help build the trend and identify trend changes. Even while moving averages are important, traders usually use them incorrectly.
Analyzing Trends with Moving Averages
Moving Averages are trailing indicators, thus they cannot detect emerging trends but can confirm and follow established ones. The moving average crossover is a great tool for spotting potential new trends, as was already mentioned.
Identifying Support and Resistance with Moving Averages
Moving averages can be used to find dynamic levels of support and resistance. It is simple to see that the price of a falling asset tends to stop and change course at the average level. Popular Moving Averages are commonly utilized as confirmation levels, and stocks typically reverse direction near these levels, either upward or downward.
Summary of Key Points
Moving averages are a useful analytical tool. Yet in order to utilize them well, one needs to be aware of how they work, know when and where to use them, and practice using a demo account. I’m wishing you luck in anything you do!