
Technical traders rely on various data points and indicators to identify trading opportunities and assist in their decision-making process while trading. In this post, we will examine two specific candlestick chart patterns: the double top and double bottom pattern. We will discuss how to identify these patterns and strategies traders can use to trade them effectively.
The double top and double bottom trading patterns are among the most common patterns traders encounter, and they serve as evidence against academics who believe that price movements in the market are entirely random. Therefore, it’s essential for traders at every level to be familiar with these chart patterns. This post will reference several technical analysis tools such as support and resistance levels, RSI, the parabolic SAR, and necklines. If you’re unfamiliar with these terms, it’s recommended that you familiarize yourself with the important trading terminology before reading further.
Free PDF Guide : Get your Mastering the Double Top and Double Bottom Patterns: A Comprehensive Guide
Table of Contents:
- Introduction to the Double Top Pattern
- Introduction to the Double Bottom Pattern
- Identifying the Double Top and Double Bottom Patterns
- False Double Top and Bottom Patterns
- Trading Strategies for the Double Top and Double Bottom Patterns
- Lastly
Introduction to the Double Top Pattern
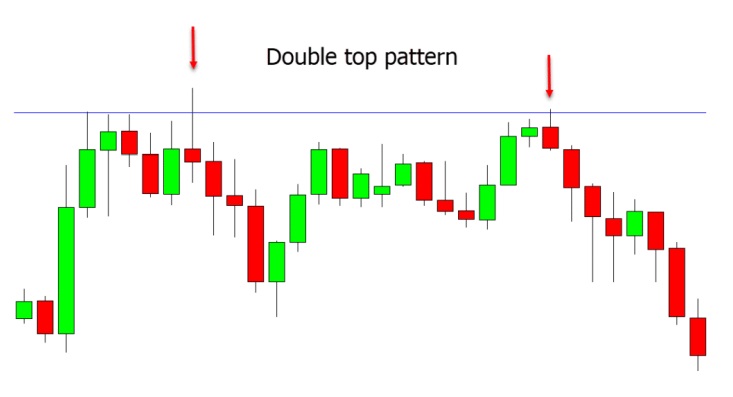
The double top pattern is a bearish technical analysis reversal pattern that signals a potential trend reversal in the security’s price. This pattern is formed when the security reaches two consecutive highs with a slight decline between them.
These two peaks are formed above a support level known as the neckline, and the pattern resembles the letter “M.” An example of a double top pattern can be seen in the chart below. The double top pattern indicates that a medium to long-term change in the security’s price is imminent, and the price is likely to begin falling.
Introduction to the Double Bottom Pattern
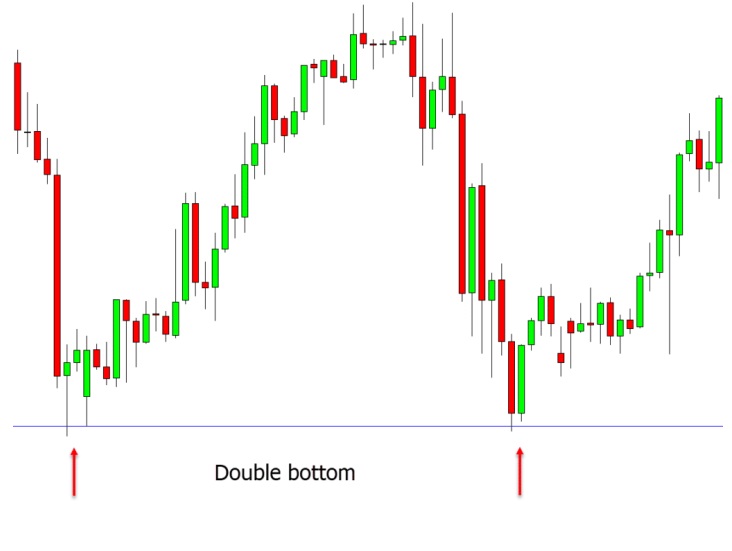
The double bottom pattern is a bullish technical reversal pattern that signals a potential trend reversal in the security’s price. This pattern is the opposite of the double top pattern and indicates a potential uptrend in the security’s price.
The pattern is formed when the security experiences two consecutive lows with a slight increase between them, forming a resistance line referred to as the neckline. The pattern resembles the letter “W,” and an example of a double bottom pattern can be seen in the chart below. This chart pattern indicates that a medium to long-term change in the security’s price is imminent, and the price is likely to begin rising.
Identifying the Double Top and Double Bottom Patterns
To identify the double top and double bottom patterns, traders must first understand why these patterns work in the first place. It’s widely accepted among technical analysts that technical trading is largely a reflection of market psychology. Traders recognize patterns in large numbers and adjust their trades accordingly.
When a large number of traders are trading on the same data, technical analysis becomes a self-fulfilling prophecy. Traders should be aware that these patterns typically form over extended periods and don’t always resemble the letters M and W. Identifying these patterns can, therefore, be challenging. To correctly identify a double top or double bottom pattern, traders must follow these steps:
- Identify a general market trend that could potentially reverse.
- Identify a top or bottom that follows the general market trend.
- Find the neckline by manually drawing a line between the two tops or two bottoms.
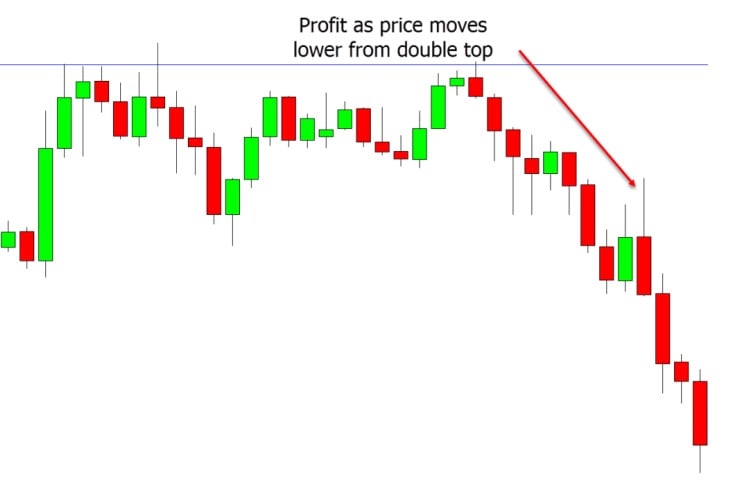
- Confirm the pattern with a neckline breakout. Once the security’s price moves beyond the neckline, the double top or double bottom is confirmed, and the trader can reliably assume that the trend has reversed. At this point, the trader can trade the double top/bottom with a high probability of success.
False Double Top and Bottom Patterns
While double tops/bottoms are powerful reversal patterns that traders look out for, there are times when these patterns can be misleading. False double tops/bottoms can occur when the price movements give the impression that a pattern is forming, but the support or resistance lines are broken, indicating that the pattern is not genuine, and the trend may not reverse.
To distinguish between a genuine pattern and a false one, traders should examine the time frame between the two tops or bottoms. The longer it takes for the two to appear, the higher the probability of being a false pattern. Conversely, the shorter the time between the two bottoms/tops, the higher the probability it is genuine. Because of the uncertainty of double top and bottom patterns forming, trading these patterns can be challenging. In the next section, we will examine how traders can trade double tops/bottoms.
Trading Strategies for the Double Top and Double Bottom Patterns
There is no guaranteed formula for trading any pattern, and no indicator can tell traders how to trade a pattern perfectly every time. Trading is subjective, and every trade, security, and moment will be unique. Traders must rely on their experience and intuition to determine how best to execute a trade.
Generally, traders can profit from double tops by opening a short position or a long position on double bottoms. However, traders should confirm the patterns with other technical indicators like RSI or parabolic SAR before taking action. These indicators are momentum indicators that can help determine trend reversals indicated by these chart patterns. Traders can use CFDs or spread betting during both a double top or double bottom pattern.
Traders can either predict or react to the confirmation of these patterns. Traders who predict the pattern will be confirmed tend to make larger gains, but they also incur more risk. Reactive traders want to see that the pattern has been confirmed before entering into the trade. Reactive traders stand to make less profit from their positions, but their risk level is considerably lower as the pattern has been confirmed.
Another critical issue for traders trading these patterns is where to place their stop losses. Traders should be cautious when implementing their stop losses when trading these patterns because institutions trading the markets are more than happy to exploit retail trading psychology to their benefit. Therefore, conventional wisdom of placing stop losses at the top or bottom of a double top or double bottom might not always work.
Lastly
Double tops and double bottoms are popular reversal patterns among traders, but they shouldn’t rely solely on these patterns when making their trading decisions. It’s essential to consider other technical and fundamental metrics before making any trades since no indicator or pattern can be entirely reliable. The most successful traders combine a range of different data points and indicators to make informed decisions.
When analyzing chart patterns, traders should also remember that it’s easy to analyze them retrospectively and identify entry and exit points. However, real-time trading with actual money involves a significant risk that requires experience and caution. Therefore, novice traders should start with small amounts of money until they gain sufficient experience.