Whether the market is trending, range, or counter-trending, a reversal trading technique has the potential to generate substantial profits. It can be used in all time frames and on a variety of financial markets, including equities, cryptocurrencies, and foreign exchange. In this article, we examine the foundations of a reversal trading strategy and offer practical advice for incorporating it into your trading methodology.
Free PDF Guide : Get your Mastering the Art of Reversal Trading: Strategies for Profit in Any Market
Table of Contents
- Understanding the Reversal Trading Strategy
- Techniques for Identifying Trend Reversals
- Exploring the 123 Trend Reversal Pattern
- Implementing an Intraday Reversal Trading Strategy
- Top Indicators for Detecting Trend Reversals
- Moving Averages
- MACD
- Basic Reversal Trading Strategy
- Leveraging Fibonacci and Price Action in Reversal Trading
- Trading Range Reversals from Crucial Support and Resistance Levels
Understanding the Reversal Trading Strategy
Profiting from price reversals is the aim of reversal trading strategies. Nonetheless, it is common for traders to be uncertain about whether they should try to predict the peak or bottom of the market or wait for a trend reversal. Reversal trading can be carried out within a trend, within a range, or even against the trend. For instance, identifying the main trend is the first stage in placing a reversal trade within an uptrend. The price is clearly going upward in the sample given below, creating higher highs and higher lows. We watch for the price to dip into a valuable or noteworthy area, frequently delineated by support or resistance levels, in order to execute a reversal trade inside this trend. From the swing low, we then place long trades in anticipation of a price turn that is consistent with the trend.
Techniques for Identifying Trend Reversals
You’ll frequently come across opportunities to place reversal trades when a trend draws to a close. Trading against the current trend can be riskier, but it also offers a greater chance of profit. You could be able to ride an extensive winning position if you can predict the beginning of a new trend early on. Two well-liked methods for spotting possible trend reversals are the moving average crossover strategy and the 123 trend reversal.
Exploring the 123 Trend Reversal Pattern
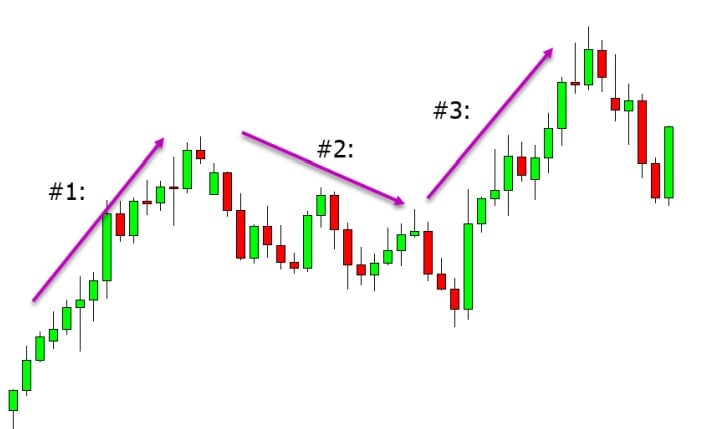
The price action pattern known as the 123 trend reversal pattern suggests that the current trend may be about to shift. There are three different moves in this pattern. For instance, in the image below, a 123 trend reversal pattern that denotes an upward trend reversal is visible. The price increases in the first leg following an initial trend. It swings lower after forming a second leg. When the price rises in the third leg, reaching the high of the first leg and creating a new higher high and a new short-term trend, the pattern and reversal are complete.
Implementing an Intraday Reversal Trading Strategy
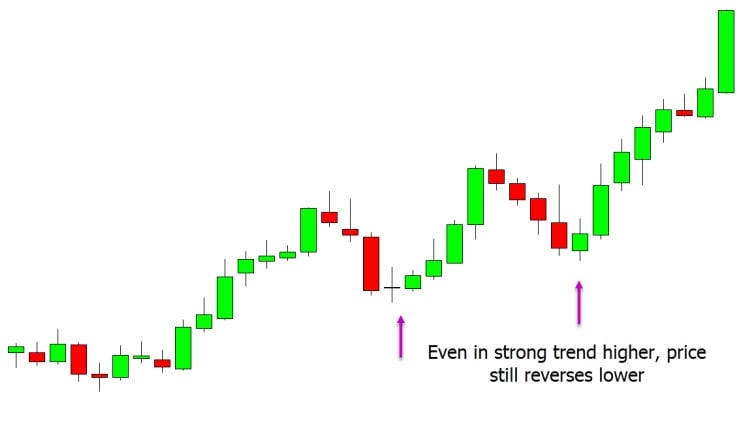
Reversal trading can be used on a variety of time frames, including intraday time frames like the 30-minute and 15-minute charts as well as higher time frame charts like the daily chart. It’s essential to use the major levels as a reference when reversal trading on intraday time frames and to stay away from trading against any obvious momentum. For instance, the price in the first sample below clearly has an upward trend, thus we would seek for long transactions. We may start long trades and expect the price to revert higher with the overall momentum when the price dips back into a clear support region.
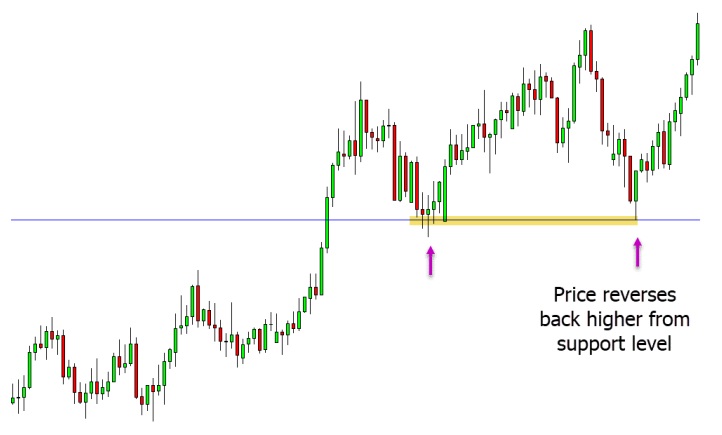
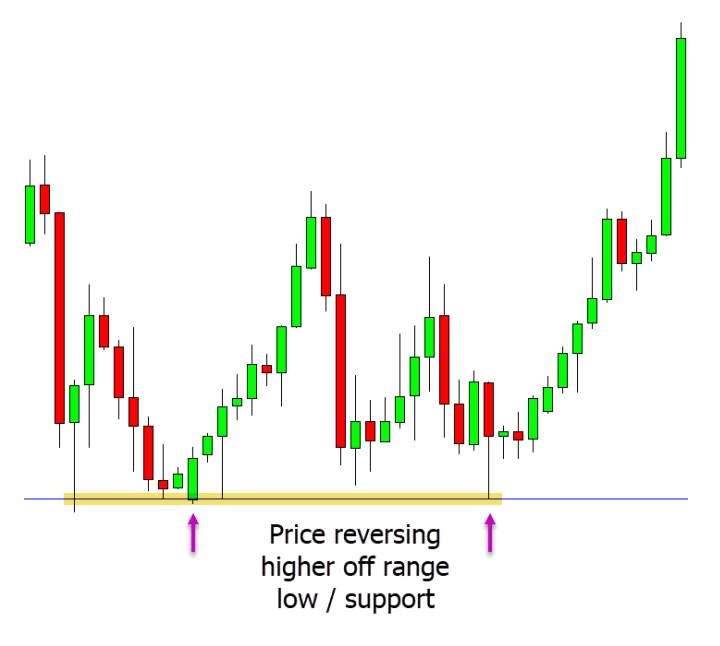
In the second illustration, there isn’t any discernible momentum or trend, so we concentrate on the levels of clear support and resistance for potential reversal trades. We can start looking for potential long trades to profit from the price turning higher and moving away from the support level after it descends and reaches the intraday’ s range support level.
Top Indicators for Detecting Trend Reversals
Moving Averages
Moving averages are one of the most frequently used technical indicators across all markets. They are helpful for taming the general price movement and for revealing the market trend. They can also aid traders in determining the strength of a trend and whether it is likely to continue or end. It is feasible to spot trend reversals and reversal trades by trading with numerous moving averages.
MACD
Another often employed indicator to spot emerging trends or momentum is the MACD. This indicator uses data from two separate moving averages to demonstrate how they interact with one another. It shows up as an oscillator on your graph and oscillates above and below the zero line. When new trends are developing and while momentum is increasing, the MACD can be watched to identify potential reversal trade setups.
Basic Reversal Trading Strategy
Leveraging Fibonacci and Price Action in Reversal Trading
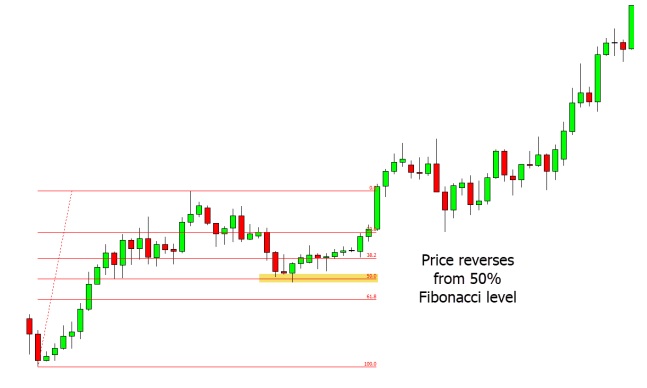
Finding high probability reversal trades across all time frames is simple when using the Fibonacci tool. This tool assists in determining when the price is likely to encounter support or resistance and may perhaps experience a new reversal. Following a retreat, the price in the next example, which is going higher, drops to the 50% Fibonacci level. As a result, at this retracement level and in line with the upward trend, we can start searching for long reversal trades.
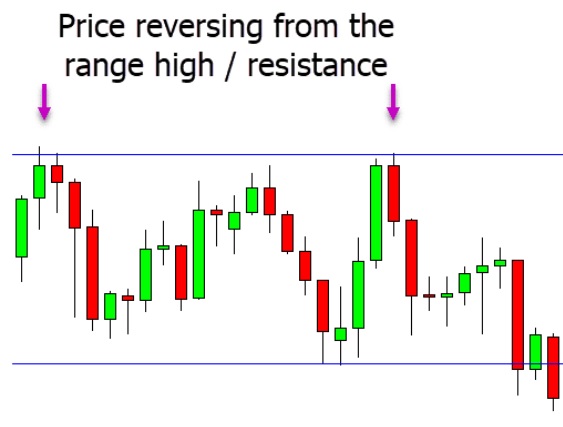
Trading Range Reversals from Crucial Support and Resistance Levels
Reversals in range trading provide a different approach that may be used on all time frames. This approach can be used for swing trading if you choose larger time frames or scalping if you prefer lower time frames. For instance, there is a distinct spectrum of support and resistance in the sample below. We can start thinking about short trades as the price approaches the high resistance level since we believe it will reject this resistance and move back down. As the price returns to the low and support level of the range, we may start looking for trading opportunities.