
The Nasdaq, the second-largest stock market in the world, provides several options for trading utilizing different approaches. Among these, technical analysis stands out as a strategy for Nasdaq trading that is very common. We examine the specifics of technical analysis in this article, as well as how it may be used to great benefit in Nasdaq trading.
Free PDF Guide : Get your Mastering Nasdaq Trading with Advanced Technical Analysis Techniques
Table of Contents:
- Understanding the Nasdaq Stock Exchange
- An Introduction to Nasdaq Technical Analysis
- Effective Strategies for Trading the Nasdaq
- Identifying Key Support and Resistance Levels in Nasdaq Trading
- Today’s Nasdaq 100 Forecast
- Lastly
Understanding the Nasdaq Stock Exchange
The second-largest stock exchange in the world is called Nasdaq, which stands for National Association of Securities Dealers Automated Quotations. It is situated in the United States. It provided investors with automatic quotes and was one of the innovators in electronic stock trading. The Nasdaq has a number of conditions that businesses must complete in order to list on the exchange. But many of the biggest businesses in the world, including some of the top internet companies, are listed on the exchange. Examples of such businesses include Tesla and Apple.
The Nasdaq stands apart from other stock exchanges thanks to its emphasis on technology and growth-oriented businesses. As a result, it has emerged as a top location for investors looking to profit from these sectors. Also, the Nasdaq has a track record for volatility, which attracts investors wanting to make rapid gains.
Technical analysis is a common method for trading on the Nasdaq. Technical analysis involves studying previous market data, such as price and volume, to uncover trends and patterns that may suggest future price movements. Any asset, even stocks, can be used in this manner, but the Nasdaq benefits the most because of how volatile it is.
Traders frequently use a variety of tools and strategies, including charting and trend analysis, to trade the Nasdaq utilizing technical analysis. Finding critical levels of support and resistance, which stand for the prices at which the stock is anticipated to see buying or selling pressure, is a typical tactic. These details can be used by traders to time their trades and join or exit the market at the right times.
The performance of the stocks that traders on the Nasdaq are trading may be impacted by recent news and events, in addition to technical analysis. This covers financial results from businesses, legislative modifications, and trends in the world economy. Trading strategies that enhance chances of success can be created by incorporating both technical and fundamental analysis.
In general, trading on the Nasdaq may be a very profitable option for both traders and investors. Traders can navigate the market with confidence and reach their financial objectives by comprehending the special features of this exchange and using efficient trading tactics.
An Introduction to Nasdaq Technical Analysis
A well-liked method of trading is technical analysis, which looks at price changes and other indications to spot prospective trading opportunities. While some traders make all of their trading choices based exclusively on price action research, others combine price action with technical indicators. Moving averages and the Relative Strength Index (RSI), two of the most popular technical indicators, aid traders in spotting trends and probable entry and exit locations.
Traders attempt to comprehend what the price has done in the past and what it may do in the future by employing technical analysis. By modifying stop losses or profit objectives, this can be useful in spotting new trading opportunities or managing already-open positions. Technical analysis is becoming more accessible and well-liked among traders as a result of the expanding availability of sophisticated charting tools.
Traders can improve their grasp of various markets and how they behave by using technical analysis. Trading professionals can spot patterns and trends that they might otherwise miss by examining price movements and indicators. Making more informed trading decisions is then possible with the use of this knowledge.
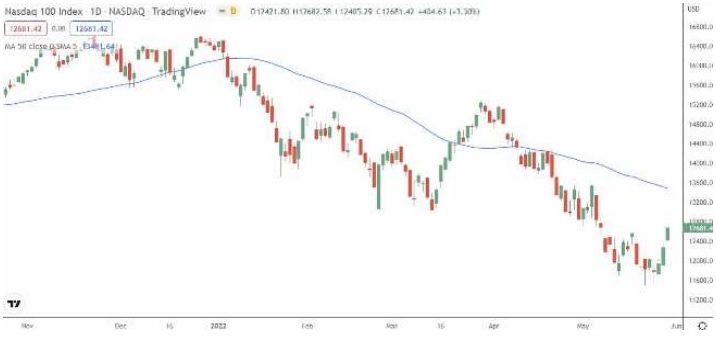
Technical analysts frequently display raw price action alongside technical indications on their charts. Trading professionals can use this to see the relationship between price changes and the indicators they are utilizing. By accentuating longer-term price changes and smoothing out short-term price variations, a moving average, for instance, might assist traders in spotting future trends.
Technical analysis is a strong instrument that may be used by traders to find trading opportunities, control their positions, and learn more about the markets they are trading. Traders can create a thorough trading strategy that increases their chances of success by integrating technical analysis with fundamental analysis and staying current with current news and events.
Effective Strategies for Trading the Nasdaq
There are two main approaches to trading the Nasdaq: long-term investing and short-term trading, which concentrates on minor price swings. Investors looking to make money on the Nasdaq typically buy and hold for lengthy periods of time in the hopes that the price will increase over time. However, traders who are aiming to trade the Nasdaq in the short term frequently place long and short transactions with the goal of capturing smaller price fluctuations.
Contracts for Difference, or CFDs, are among the most popular ways to trade the Nasdaq because they have a number of benefits over other trading strategies. With CFDs, traders can use leverage to their advantage by making long or short bets while following the Nasdaq price through a contract. With the use of this tool, traders are able to open positions that are larger than what their capital would otherwise allow. Moreover, CFDs are a common choice among traders since they often offer lower trading fees than other types of trading.
Trading CFDs on the Nasdaq offers traders a great deal of flexibility because they can be applied to a variety of markets, which is one of the most important benefits. Additionally, CFDs give traders the chance to earn from both rising and falling markets, allowing them to take advantage of market volatility in either case.
Effective Nasdaq trading requires traders to be current on news and events that could impact the performance of the equities they are trading. This include keeping an eye on corporate earnings reports, general economic trends, and potential market-impacting regulatory changes. Trading strategies that enhance chances of success can be created by incorporating both technical and fundamental analysis.
Finally, trading the Nasdaq can be a profitable option for both traders and investors. You may traverse the market with confidence and reach your financial objectives by understanding the specific characteristics of the market and using efficient trading methods, regardless of whether you like trading with shorter time frames or investing over longer periods of time.
Identifying Key Support and Resistance Levels in Nasdaq Trading
One of the most often employed technical analysis trading tactics is the usage of support and resistance levels. Because price has a tendency to replay past events, historically significant regions of support and resistance are likely to continue to be so in the future.
There are two main methods that traders might use support and resistance levels. They can first look for the support/resistance level to hold before entering a trade in search of a reversal. In this case, traders would wait for the price to enter the support or resistance level before entering a trade in the opposite direction, hoping for a change in the direction of the price.
As an alternative, investors might search for the support/resistance level to break and place breakout trades. In this case, traders would wait for the price to cross the support or resistance level and then place a trade in that direction, anticipating that the price would stay there.
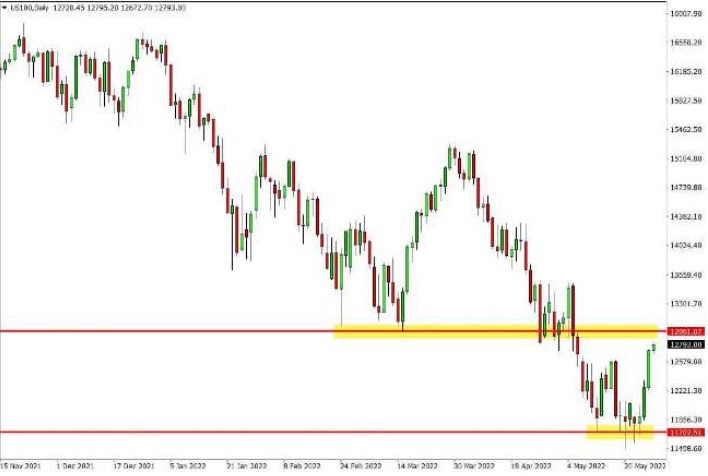
The graph below shows the active support and resistance levels. When the price moves into support, a trader trying to use the support level would look to enter a buy position. On the other hand, if the price climbs higher and into a level of resistance, a trader might consider going short and waiting for the price to descend and move away from the level of resistance.
Trades should combine fundamental and technical analysis in order to properly use support and resistance levels. This entails keeping abreast of recent news and events that can affect the market, examining previous price movements, and determining pertinent support and resistance levels.
Also, as support and resistance levels are susceptible to fakeouts and false breakouts, traders should exercise caution when using them. Fakeouts happen when the price briefly breaks through a support or resistance level before swiftly returning to its former range, whereas false breakouts happen when the price appears to break through a support or resistance level but then immediately reverses.
In conclusion, traders looking to make wise trading decisions can benefit greatly from using support and resistance levels. Traders may confidently navigate the markets and increase their chances of success by learning how to recognize and use support and resistance levels. While trading with support and resistance levels, traders should exercise caution as they are prone to fakeouts and false breakouts.
Today’s Nasdaq 100 Forecast
The Trading View Nasdaq gauge is one of the best resources accessible for traders who want to trade the Nasdaq. This indicator offers important information about the market’s suitability for buying or selling as well as the intensity of mood in the marketplace.
A variety of technical indicators, such as moving averages, pivot points, and oscillators, are used to form the Trading View Nasdaq gauge. In order to offer a reliable estimate of the general market sentiment, these indicators are weighted carefully.
By assisting them in locating probable entry and exit locations, traders can utilize the Trading View Nasdaq gauge to guide their trading decisions. Traders can better comprehend market movements and make more intelligent trading decisions by tracking the gauge over time.
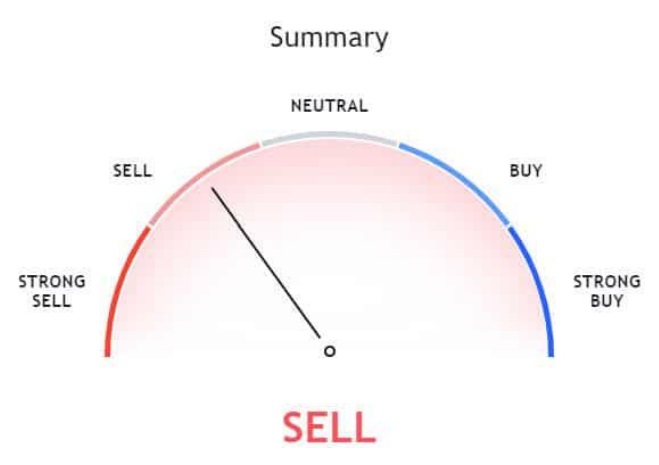
You may find the Trading View Nasdaq gauge online and it is really convenient. In most cases, the gauge is shown as a line chart or bar chart, with green bars denoting a positive attitude and red bars denoting a negative one. The strength of the sentiment is shown by the height of the line or the length of the bars; longer bars or higher lines signify stronger sentiment.
Below is a screenshot of the Trading View Nasdaq gauge in action:
[Illustration: TradingView.com/symbols/NASDAQ-NDAQ/gauge/]
Traders should employ additional tools and strategies, such as technical analysis and fundamental research, in addition to the TradingView Nasdaq gauge to maximize their effectiveness. This entails keeping track of news and events that can have an impact on the market, examining previous price movements, and finding crucial support and resistance levels.
The Trading View Nasdaq gauge, taken as a whole, is a useful tool that can assist traders in making better informed trading decisions. Trading professionals can navigate the Nasdaq market with greater assurance and increase their chances of success by using this indicator in conjunction with other analysis methods.
Lastly
Technical analysis trading on the Nasdaq can be a difficult endeavor that calls for perseverance and commitment. Traders must be prepared to invest the time and effort necessary to create and hone their technical analysis tactics in order to execute lucrative transactions. This entails looking back at previous price movements, finding significant indications, and putting new tactics to the test to see how well they work.
Continuous practice and learning are two key components of mastering technical analysis. The markets are continuously changing, and traders must stay up-to-date with the latest news and events that may effect their transactions. Also, traders should constantly search for fresh technical analysis methods and tools that could enhance their trading approaches.
Using a free sample account is a good approach to test new trading tactics. Demo accounts give traders a risk-free setting where they may experiment with new tactics and hone their abilities without putting any real money at risk. Before switching to actual trading, this enables traders to gain crucial experience and confidence in their tactics.
Traders who use technical analysis to trade the Nasdaq should also think about utilizing other tactics and tools, including as fundamental analysis and risk management. To forecast a company’s future success, fundamental analysis include examining its management, competitive position, and financial health. Instead, risk management tactics entail establishing stop-loss orders and profit objectives in order to reduce losses and increase profits.
In conclusion, using technical analysis to trade the Nasdaq can be a difficult but worthwhile exercise. Trading decisions can be improved by gaining a deeper grasp of the markets and mastering technical analysis. To be successful, traders must be prepared to invest the time and effort necessary to create and hone their strategies, stay current on market news and events, and apply additional tools and techniques, such as risk management approaches and fundamental research.