
Warren Buffet is well-known to stock market investors and potential investors. Starting at a young age, the billionaire made his money by making stock investments. He would respond “basic analysis” if you asked him the key to successful stock market investing. What fundamental analysis of stocks comprises and how to use it in your trading strategy are both covered in this piece.
Table of Contents
- Introduction to Fundamental Analysis of Stocks
- Comparison of Fundamental Analysis and Technical Analysis
- Essential Components of Fundamental Analysis
- Step-by-Step Guide to Conducting Fundamental Analysis
- Real-World Applications of Fundamental Analysis
- Recommended Reading Material
- Final Thoughts
Introduction to Fundamental Analysis of Stocks
Warren Buffet is well-known to stock market investors and potential investors. Starting at a young age, the billionaire made his money by making stock investments. He would respond “basic analysis” if you asked him the key to successful stock market investing. What fundamental analysis of stocks comprises and how to use it in your trading strategy are both covered in this piece.
Gaining a thorough knowledge of a company’s financial situation and potential is the aim of fundamental analysis. This approach is used by investment experts to make well-informed stock purchase or sale choices. Fundamental analysts hold that, notwithstanding variations brought on by irrational or speculative factors, the intrinsic worth of a firm can be assessed based on its operational operations, and that stock prices always have a tendency to move in the direction of this value over time.
A company’s shares each reflect a little portion of the company’s value. Fundamental analysts contend that a company’s stock market price only partially reflects its underlying value. Analysts use fundamental analysis to look at a company’s financial and economic data over a lengthy period of time to acquire a more accurate picture of its value. They can reach their financial objectives and make informed stock market investment decisions with the help of this knowledge.
Comparison of Fundamental Analysis and Technical Analysis
The foundation of fundamental stock analysis is the conviction that, over the long term, only strong companies can deliver rising stock prices and substantial dividends. While a company’s share price could first appear to be excessive, over time it should reflect its underlying value. Unlike technical analysis, which primarily concentrates on stock market data like prices, the analyst considers business and economic facts while determining this value. However, the share price is still crucial since even strong prospects lose their value if the price is too high.
Investors who utilize fundamental analysis look at the company’s performance as well as the general economic and competitive landscape. It may not be appropriate for short-term investments, such as day trading or CFD trading, even if it can be beneficial for long-term investments because it can take a while for a stock’s intrinsic value to be reflected in its market value.
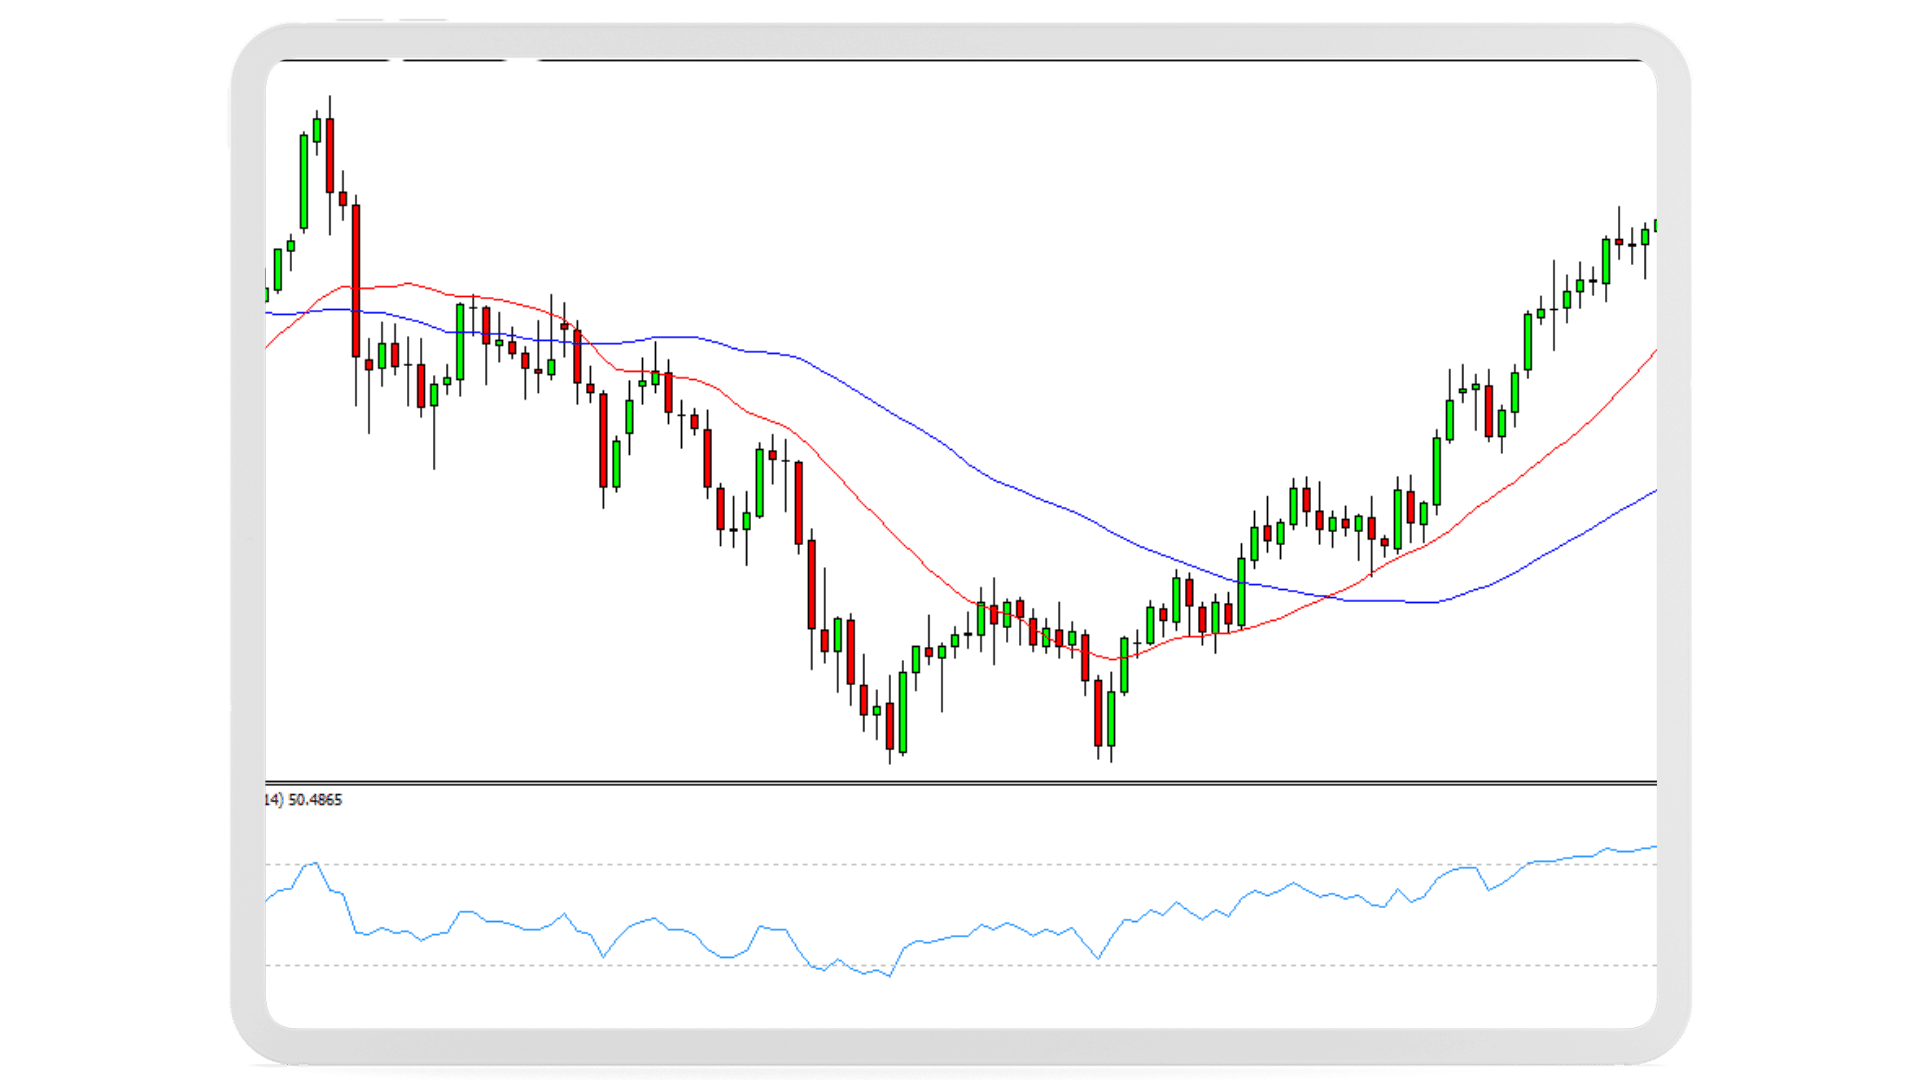
On the other hand, technical analysis focuses on tracking the price and volume changes of equities. This technique has been utilized for about a century to forecast market participants’ actions and price changes, mostly through chart analysis. Since the Efficient Market Hypothesis holds that all significant news is represented in the current stock prices, technical analysts do not need balance sheets, annual reports, or corporate vital numbers.
Fundamental Analysis vs Technical Analysis
Essential Components of Fundamental Analysis
In fundamental analysis, several measures, as opposed to simply one or two, are taken into account. The analysts assess the company’s strategy, management’s effectiveness, capacity for innovation, and market competitiveness. The company’s financial health and profitability can be determined by carefully reviewing the financial statements.
Some of the metrics used in fundamental stock analysis include the ones listed below:
Fundamental Analysis Tools
In stock analysis, the Price-to-Earnings (P/E) ratio is a popular statistic. It is figured out by dividing a stock’s current market value by its earnings per share. This straightforward formula gives a stock’s relative value in relation to its competitors in the same sector.
The ease with which the P/E ratio compares the company’s prior-year net income to its present stock price is one of its benefits. It’s crucial to remember that a low P/E ratio does not always signify a solid investment opportunity. It is simply one of many variables to take into account when assessing a stock.
Therefore, while the P/E ratio is a valuable tool for stock analysis, it should not be relied upon as the sole or unconditional criterion for making investment decisions.
Price-to-Sales Ratio (P/S Ratio)
The P/S ratio is used to evaluate a company’s worth in relation to its stock market price. The P/S ratio is computed by dividing the price per share by the revenue per share, as opposed to the P/E ratio, which divides the current share price by earnings per share.
Price-to-sales ratio = the price per share divided by the revenue per share
The P/S ratio offers a more true picture of a firm’s financial health than the P/E ratio, which is influenced by how a company reports its earnings and can be altered through inventive accounting techniques. It is a crucial tool for comparing various companies since it provides information about the market capitalization of the firm in relation to its sales.
It’s crucial to remember that when choosing which stocks to buy, the P/S ratio shouldn’t be the only or deciding criterion. In order to obtain a thorough picture of a company’s financial situation and potential, it should be utilized in conjunction with other financial measures.
The Enterprise Value (EV)
This metric is used to learn how a company’s equity relates to its market capitalization.
P/B = share price/book value of the share
The carrying amount is calculated by dividing the equity by the total number of shares issued. As a result, it shows the equity to share count ratio.
It calculates the net asset value, which is equal to the total value of all assets at market value less any outstanding debt. It is the price a potential buyer would be willing to pay if he were to break up the company and sell the assets individually.
The book value is not the same as equity; certain adjustments must be made. The book value is the carrying amount determined by the balance sheet’s conclusion of the sum of the assets minus the liabilities; this correlates roughly to equity.
The following definition seems to make the most sense, despite the fact that there is no standard calculation method for the carrying amount: reported equity less shares of third-party shareholders, less dividend payout, less goodwill.
Due to the fact that they cannot dispose of these two factors, i.e., they cannot be considered as assets, the shares of foreign shareholders and the dividends agreed but not yet disbursed are removed. Finally, goodwill reflects an intangible value that is typically impossible to “monetize” in the event that a firm fails.
The Price-to-Book Ratio (P/B)
A company’s equity and market capitalization are compared using the Price-to-Book (P/B) ratio. By dividing the share price by the book value per share, this ratio is derived.
P/B = share price/book value of the share
The equity divided by the number of issued shares is represented by the book value per share, which shows the equity to shares ratio. It displays the net asset value, which is the total market value of all assets less any outstanding debt. It shows what a prospective buyer would provide if the company were to be dissolved and its assets sold separately.
The book value must be adjusted, thus it is not exactly the same as equity. A typical definition of book value is reported equity less shares owned by third parties, less dividends that have been decided but not yet paid, and less goodwill.
Foreign shareholders’ shares and unpaid dividends are deducted because they cannot be sold or included in the asset count. In the event of a company’s collapse, goodwill signifies an intangible worth that is often impossible to convert into cash.
Dividend Yield
Investors can better comprehend the relationship between share price and dividend paid or announced by a firm by looking at the dividend yield. Many businesses make their dividend yield available to investors.
To calculate the dividend yield:
Dividend yield percentage = (dividend per share / share price) x 100
The dividend yield can rise if you purchased the stock at a discount to its current market value. On the other hand, if the share price rises, the dividend yield can go down. To maximize the likelihood of a consistent increase in share price, it is crucial to examine the dividend yield over a number of years.
Dividends, however, are frequently correlated with a company’s profits and may decline if profits decline. Companies in mature or falling markets typically pay bigger dividends, but businesses in emerging markets may forgo paying dividends altogether or do so at a very low level as they reinvest their earnings.
Guide to Conducting Fundamental Analysis
When evaluating a stock using fundamental analysis, current data and information produced by the company and its surroundings are used. This covers not just current data but also historical data and projections for the future. This is so because the value of a stock is greatly influenced by predictions for the future. Usually, the following factors are taken into account:
Quantitative Business Analysis
Utilizing the financial and balance sheet data included in the yearly financial statements, interim reports, and other numerical corporate data, the worth of a firm is determined. By identifying significant parameters, this data enables comparison with other businesses.
Qualitative Business Analysis
With this strategy, an effort is made to forecast the company’s growth and future. Information can be obtained from a number of places, including management reports, annual reports, other company publications, or by speaking directly with the management or staff. The goal is to evaluate the effectiveness of the company’s operations and business plan.
Because it relies on subjective evaluation criteria, qualitative analyses require highly skilled analysts and can produce subjective outcomes.
Industry Analysis
An examination of the industry in which the company operates is conducted. It analyzes the supply and demand factors, the competition, the industry’s structure, the industry’s dependence on the overall economy, and the effect of pertinent political decisions on the company’s value.
Global Analysis
The macroeconomic aspects that affect the company’s expansion are assessed by the worldwide analysis. It considers the possible impacts of monetary and fiscal policies, interest rate choices, movements in currency rates, and global commerce, all of which may have a favorable or negative impact on the company’s outlook and value.
Examples of Fundamental Analysis
One statistic that is frequently employed in stock analysis is the P/E ratio. It is the association between the share price of a firm and its earnings per share. High P/E ratios might suggest significant investor demand for a stock and probable overvaluation, but they can also imply good sales or earnings growth for the company.
A low P/E ratio, on the other hand, indicates that the company is cheap in comparison to its earnings. This does not imply that it is a smart investment, either, as a low P/E ratio may also reflect bleak earnings expectations. You can readily find the P/E ratios of firms like Apple (AAPL) and Microsoft (MSFT) on financial websites like Yahoo Finance. For instance, the P/E ratios for AAPL and MSFT are 32.62 and 37.88, respectively. MSFT is selling at a higher P/E at the time of writing, indicating that investors are prepared to pay more for the company’s better profits potential.
Recommended Reading Material
“Fundamental Analysis For Dummies” by Matt Krantz and “Warren Buffett’s Accounting Book: Reading Financial Statements for Value Investing” are two highly respected books on stock fundamental analysis.
Fundamental Analysis by Matt Krantz
The fundamental analysis teachings in this book, first published in 2009, remain relevant to the market even over a decade later. Some of the key takeaways include:
- An explanation of what fundamental analysis is and its significance.
- Sources for obtaining accurate fundamental data for a company.
- Comprehensive analysis of financial statements and tracking of crucial financial data over time.
- The importance of considering a company’s cash flow instead of just earnings.
- The use of financial ratios to identify suitable investment opportunities.
- Ways to prevent investment loss when using fundamental analysis.
- Incorporating public comments and statements to analyze a company.
Fundamental analysis
Warren Buffett Accounting Book
These are some of the key lessons that investors can learn from Stig Brodersen’s book, published in 2014:
- Techniques for selecting stocks like Warren Buffett
- Methodology for determining a company’s inherent value
- Understanding of the Balance sheet, Cash flow statement, and Income statement and their interpretation
- Knowledge of calculating and analyzing essential financial ratios.

Warren Buffett Accounting
Final Thoughts
Depending on the state of the market, several financial indicators are chosen to evaluate companies. There should ideally be two approaches to valuation. Buying inexpensive stocks and selling overvalued ones would be a simple process if the stock market behaved logically.
However, investors do not always act logically, with emotions like greed and fear having a significant impact. Risk-taking behavior is influenced by confidence in the future, which is prone to frequent fluctuations.