
Applying bearish candlestick patterns is a highly effective way to spot probable price falls or ongoing downtrends. These patterns allow you to quickly and easily identify market reversals or areas where possible selling pressure is rising. In this post, we’ll look at some of the most well-known bearish candlestick patterns and talk about how to use them in your trading plan.
Table of Contents
- Understanding Bearish Candlestick Patterns
- Trading Strategies for Bearish Candlestick Patterns
- The Hanging Man Pattern: A Sign of Caution
- Dark Cloud Cover: A Reversal Indicator
- The Bearish Engulfing Bar: A Strong Signal
- Shooting Star: Warning of a Potential Downtrend
- The Evening Star Pattern: A Reversal Confirmation
- Three Black Crows: A Prolonged Bearish Signal
- Final Thoughts
Understanding Bearish Candlestick Patterns
Bearish candlestick patterns are useful indicators of when a price may be about to move downward. These designs might be simple single-candle forms or more intricate ones that emerge across a series of candlesticks. The creation of bearish candlestick patterns within the larger framework of price movement is significant.
In the parts that follow, we’ll go into more detail on the subject, highlighting how crucial it is to recognize the most trustworthy patterns that appear in key locations and indicate the likelihood of a downward price movement. Traders can better recognize potential shifts in market mood and make more educated judgments by comprehending and studying these patterns in relation to the general market conditions.
Trading Strategies for Bearish Candlestick Patterns
Bearish candlestick patterns can be used in your trading approach in one of two ways:
- the process of locating and taking short positions.
- managing current open trades.
The objective of using bearish candlestick patterns to open fresh trades is to identify occasions when the market can possibly reverse course and trend lower. For instance, if the price has been moving upward, you should watch out for specific patterns that could indicate a likely reversal to the downside.
In contrast, the goal of using bearish candlestick patterns to manage your open trades is to identify the best times to take a profit or modify your stop-loss order. You can use this information to either secure your profits or adjust your stop-loss level if you are currently long and a pattern appears that suggests the price may be going to decline against your bet.
Traders can make better judgments, reduce risks, and increase their potential profit in a variety of market conditions by incorporating bearish candlestick patterns into both trade initiation and management.
The Hanging Man Pattern: A Sign of Caution
If a price has been rising or going upward, the Hanging Man pattern emerges as a bearish reversal indication. This trend indicates that the price may change course and start to fall. A single candlestick made in the shape of a hanging man has an extended bottom wick, a short or nonexistent upper wick, and a small body.
This pattern shows that the bullish momentum may be waning, possibly signaling an oncoming negative movement, as shown in the chart below. In order to effectively suggest a likely price reversal, the Hanging Man pattern must first arise after an upward price trend.
Trading professionals can obtain important insights about prospective changes in market mood and ready themselves for potential changes in price direction by carefully studying and evaluating the Hanging Man pattern in the context of a rising market. Early pattern recognition can aid traders in making more educated judgments, better risk management strategies, and maximizing fresh possibilities.
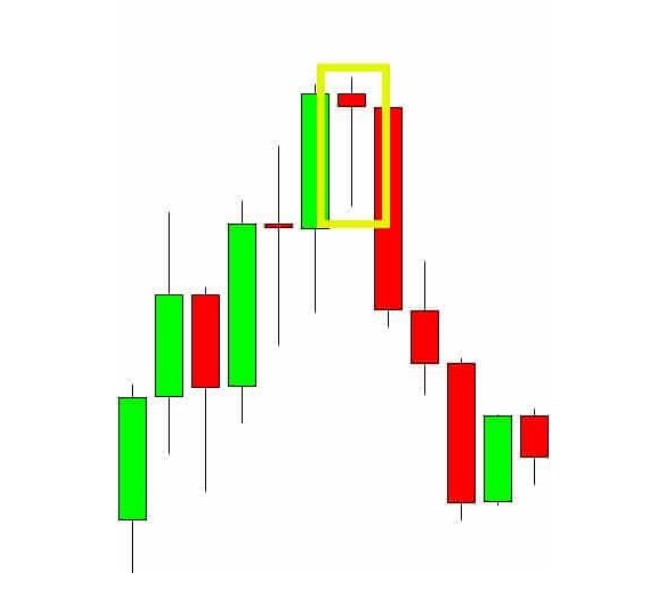
Dark Cloud Cover: A Reversal Indicator
A bearish reversal candlestick pattern called the Dark Cloud Cover typically appears after the market has been rising or trending upward. This two-candle pattern suggests that sellers may be taking control of the market, which could result in a decline in price.
A price gap higher than the previous candlestick must first be seen in order to identify the Dark Cloud Cover pattern. After this gap, the price continues to fall, with the second candle dramatically closing below the prior candle’s 50% level. This pattern of price changes indicates a change in market mood as sellers take control of the dynamics of the market.
Traders can anticipate and get ready for potential price direction changes thanks to the Dark Cloud Cover pattern, which offers useful insights into market reversals. Trading professionals can take advantage of fresh chances when the market environment changes by accurately spotting and understanding this pattern in the context of an uptrending market.
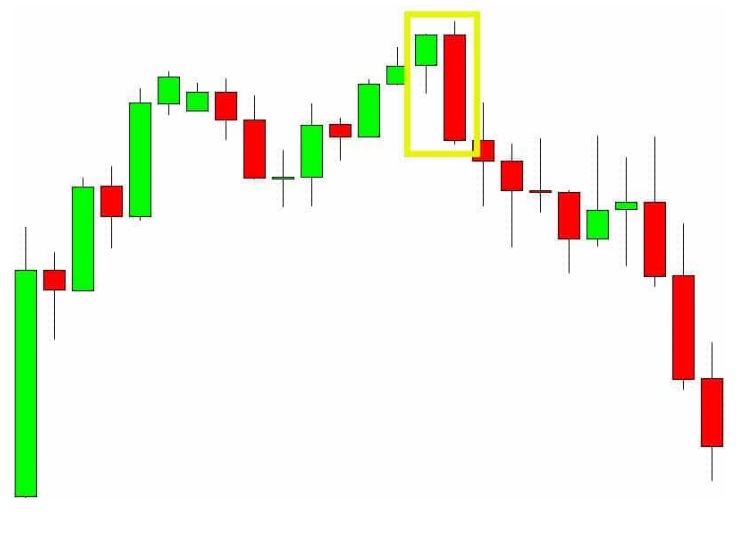
The Bearish Engulfing Bar: A Strong Signal
A highly significant and relatively easy to recognize candlestick pattern is the bearish engulfing bar. This pattern suggests that sellers have taken control of the market and that a price decline may be on the horizon.
The preceding candlestick must be entirely engulfed by the engulfing bar for a pattern to be categorized as a bearish engulfing bar. This means that the engulfing bar should surpass both the previous candle’s high and low. It is also preferable to see the price close in the lower third of the candle, which shows that sellers kept control through the end of the session.
The Bearish Engulfing Bar pattern helps traders foresee and get ready for probable shifts in price patterns by providing useful insights into potential market developments. Trading professionals may make educated judgments, better manage risk, and take advantage of new opportunities as they arise in the always changing market environment by skillfully spotting and interpreting this pattern within the context of market dynamics.
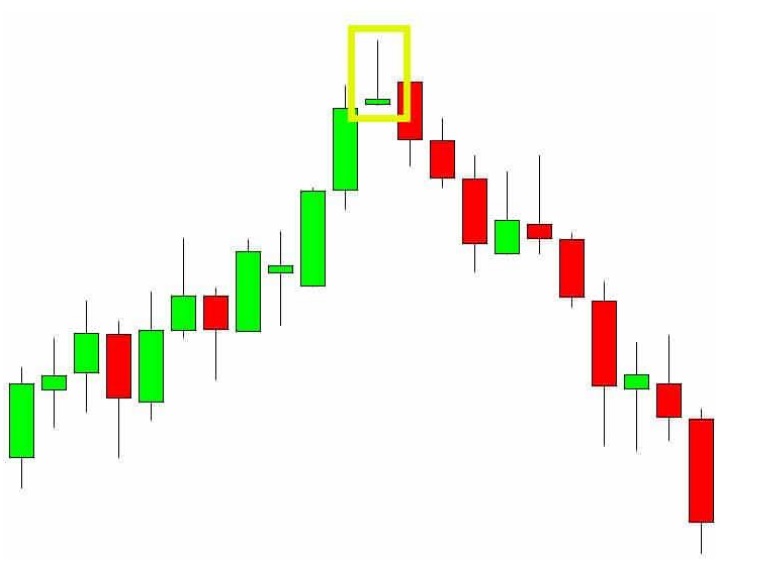
Shooting Star: Warning of a Potential Downtrend
The Shooting Star candlestick pattern trading strategy depends on a pattern that suggests a likely change in price trajectory to a lower trajectory in the short term. This pattern ought to appear following the observation of a market movement or upward trend.
Look for a candlestick with a noticeable upper wick, a small body, and little to no lower shadow to spot the Shooting Star pattern. A Shooting Star pattern is demonstrated in action in the example given below.
It is clear from the huge upper wick that bullish forces attempted to push the stock higher. However, negative investors intervened and were able to change the momentum, which caused the price to drop once more. This pattern signals a probable change in market attitude, where the bears may take control and the price may decline.
Traders can obtain important insights into anticipated changes in price direction by correctly identifying and analyzing the Shooting Star pattern within the context of current market conditions. This empowers businesses to take advantage of new opportunities as the market landscape changes by making better-informed judgments, managing risk effectively, and doing so.
The Evening Star Pattern: A Reversal Confirmation
When an upward trend may be coming to an end and a downward movement is likely to start, the Evening Star pattern can help. Despite being smaller and less common than some other candlestick patterns, this one still provides useful information about market reversals.
This multi-candlestick arrangement is called The Evening Star. It begins with a huge bullish candlestick that is followed by a much smaller candle where the price only slightly rises. Ultimately, a sizable bearish candle shows up, signaling that sellers are trying to take back the market.
The Morning Star pattern, on the other hand, denotes a bullish reversal and suggests that a downtrend may be about to turn upward. Traders can better recognize future shifts in market mood and price direction by comprehending and correctly identifying both the Evening Star and Morning Star patterns. They can use this information to make well-informed decisions, manage risk properly, and seize new possibilities in the market environment that is continuously changing.
Three Black Crows: A Prolonged Bearish Signal
Although less often, the Three Black Crows pattern can be a strong indicator of a bearish reversal. Three consecutive huge bearish candlesticks with little to no wicks on each end makeup this simple pattern.
To find new bearish trading chances or to manage open positions, use the Three Black Crows pattern. However, it is advisable to use this pattern in conjunction with other technical indicators and price action analysis to confirm a downward swing in order to enhance its efficacy and dependability.
The Three Black Crows pattern can help traders identify probable market reversals and changes in mood by incorporating it into a comprehensive trading plan. In the constantly shifting market environment, this information can assist them in making more informed decisions, managing risk effectively, and seizing new possibilities. Seeing this pattern within the larger context of market conditions is crucial, and using additional technical tools and analysis approaches to confirm its relevance will help.
Final Thoughts
The three black crows pattern is a rare but highly significant sign of a likely financial market bearish reversal. Three huge bearish candlesticks that are consecutive and all have minimal to nonexistent wicks on their upper and lower ends make up this pattern. For traders looking to spot and profit from developing negative trends or to efficiently manage their open positions, the existence of the three black crows pattern can be a useful tool.
Although this pattern’s simplicity makes it simple to spot, it works best when combined with other indications and a careful examination of price activity to confirm a downward trend. By taking a diversified strategy, traders can increase the three black crows pattern’s accuracy and reliability, improving their capacity to take advantage of potential bearish reversals and reduce risk in their trading strategies.