Understanding Multiple Time Frame Trading: Using more than one time frame to analyze and execute trades is a popular approach in technical analysis and price action trading. This method provides a comprehensive view of the price movement and enables traders to make better entries with smaller stop losses. This article will guide you through the concept of multiple time frame trading and how you can implement it in your trading strategy.
Table of Contents:
- Understanding Multiple Time Frame Trading
- Methodology of Multiple Time Frame Trading
- Confluence of Multiple Time Frames
- Trading with Three Time Frames
- Indicators for Multiple Time Frame Trading
- Strategies for Multiple Time Frame Trading
Understanding Multiple Time Frame Trading
When trading using various time frames, you use a number of time periods to determine an asset’s price. For instance, you might consider the daily chart, the 4-hour chart, and the 30-minute chart when trading the EURUSD. Using different time frames is justified in order to gain a thorough grasp of the overall price behavior. Every interval of time has its own patterns and variations. The price action and signal zones are stronger and move more slowly with a longer time frame. On the other hand, the more time you have, the more noise and false moves you may encounter. It is possible to get a precise and clear depiction of the price activity by mixing several time frames.
Methodology of Multiple Time Frame Trading
The purpose of using various time frames is to create a more accurate picture of the technical analysis and price action story. For instance, you can start looking for long trades if you find that the higher time frames, like the daily chart, are showing an upward trend. Trading only on the daily time frame, however, can result in a wider stop loss and a less-than-ideal entry point. Alternatively, you might advance to smaller time frames and use the data from the daily chart. You might be able to find the best entry point for a long trade by using a shorter time frame, such as the 30-minute chart. This would enable you to establish a tight stop loss and possibly attain a much higher risk-to-reward ratio.
Confluence of Multiple Time Frames
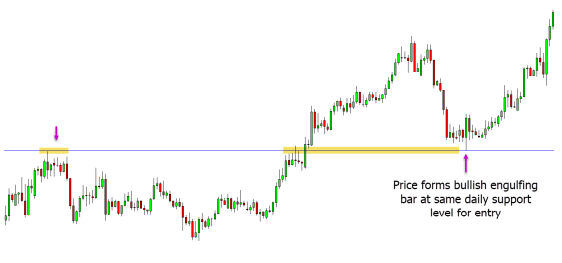
To achieve a higher degree of confluence in their transactions, traders frequently employ various time frames in their trading. Using various time frames enables traders to create a clearer representation of the overall price action narrative whereas relying on a single time frame only delivers limited information. For instance, have a look at the illustration below, where the daily chart shows a price trend that has retraced to a strong support level.
A tighter stop loss can be maintained by looking for a more favorable entry signal to start a long trade by examining the same pair on a shorter time frame, like the 1-hour chart. In this case, the price followed the daily chart trend and produced a bullish engulfing bar near the daily support level.
Trading with Three Time Frames
Three time frames are typically used by traders when analyzing their deals across multiple time windows. This strategy is used because it enables a higher time frame, such as the daily or weekly, which offers a summary of the whole price activity. The day’s events can then be shown using an intraday time frame, such as a 4-hour or 1-hour chart. Finally, finding the greatest trade entries might be aided by using a shorter time period, like the 30-minute or 15-minute chart. Lower time frames reveal more noise and more false signals, whereas higher time frames, like the daily chart, clearly show a trend or range. Traders can accurately predict where the market might be headed and attempt to place exact entries by mixing higher and lower time frames.
Indicators for Multiple Time Frame Trading
The difficulty of using indicators across several time frames is one of the limitations of most trading platforms. For instance, one needs to turn to the 1-hour chart in order to observe the behavior of a moving average there. Multiple time frame trading, which enables traders to watch other time frames without traveling to them, can be implemented to alleviate this problem. Determining the behavior of a certain moving average on the 1-hour chart without leaving the daily chart, for example, might be useful when examining a Forex pair on the daily chart. Meta Trader provides free custom indicators like moving averages, RSI, and stochastic that can be used for various time frame trading, despite the fact that they are not incorporated into their charts.
Strategies for Multiple Time Frame Trading
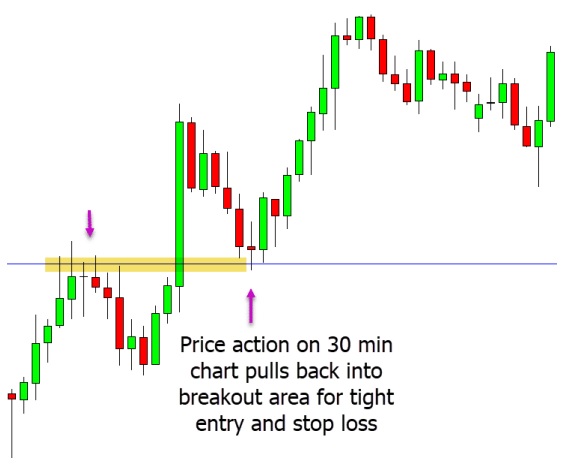
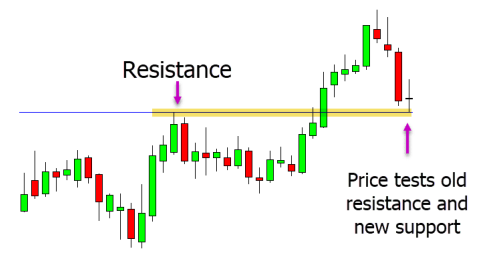
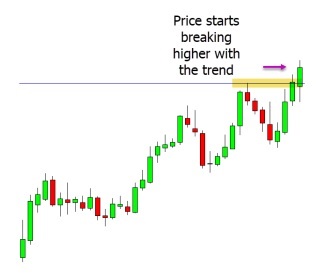
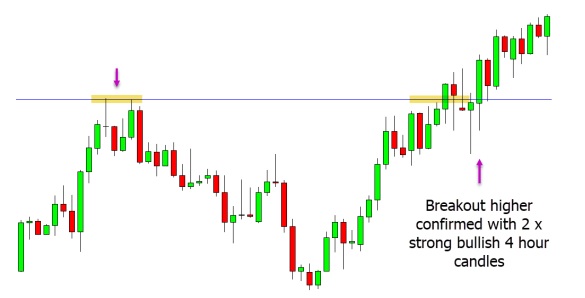
Following the upper time frame’s momentum while using the lower time frames to locate entry points is a suggested approach in multiple time frame trading. The daily, 4-hour, and 30-minute time frames are represented on three charts of a currency pair in the example that follows. In the daily chart, we can see that the price broke over an important resistance level while still following the trend upward.
The price reinforced the breakthrough on the 4-hour chart with two sizable bullish candles, suggesting that we should seek for long bets with this fresh momentum. We can find a better entry opportunity on the shorter 30-minute chart with a smaller stop loss and a higher possible risk-to-reward ratio.
We can start a long entry when the price retraces to a definite support level and profit from the ensuing upward movement that follows the trends of the higher time frames.