
Oscillating indicators are utilized to identify when securities are overbought or oversold, enabling traders to enter at the most advantageous price. There are various momentum oscillators available to traders, with the MACD being one of the most widely used. This guide will primarily focus on the MACD and how it can be combined with other strategies to improve trading outcomes.
Free PDF Guide : Get your A Comprehensive Guide to Moving Average Convergence Divergence Trading
Table of Contents:
- Introduction to MACD
- How to Incorporate MACD in Your Trading Using Moving Average Convergence Divergence
- Strategies for Trading with MACD
- The Most Popular MACD Combination
- Combining MACD with Money Flow Index (MFI)
- Combining MACD with Triple Exponential Moving Average (TEMA)
- Combining MACD with Triple Exponential Average (TRIX)
- Combining MACD with Awesome Oscillator (AO)
- Recap and Conclusion
Introduction to MACD
The MACD, or Moving Average Convergence Divergence, is a technical tool utilized to detect emerging trends or momentum by illustrating the correlation between two moving averages’ prices. Among the various indicators available for trading, including “Lagging, Leading, and Confirming,” the MACD uses the variation between short-term and long-term price action patterns to anticipate potential movements. By tracking the convergence and divergence of moving averages, MACD fluctuates above and below the zero line, revealing both the momentum and trend direction.
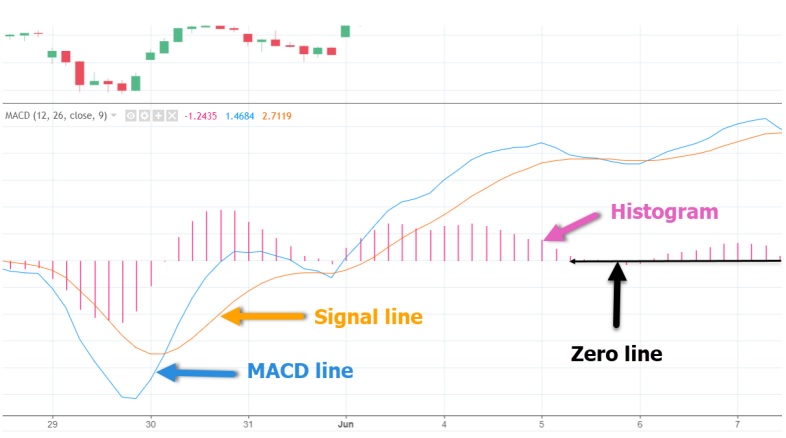
The MACD generates signals through three key elements:
- The MACD line: This is derived by subtracting a longer-term Exponential Moving Average (EMA) from a shorter-term EMA.
- The Signal line: This is an EMA of the MACD line, consolidated into a single component.
- The Histogram: This quantifies the gap between the MACD and its Signal line. The disparity between the two fluctuates above and below the Zero Line.
How to Incorporate MACD in Your Trading Using Moving Average Convergence Divergence
The MACD chart settings include three parameters:
- The faster-moving average: This specifies the number of periods used in the calculation.
- The slower-moving average: This determines the number of periods employed.
- The gap between the faster and slower moving averages: This indicates the number of bars used in the calculation.
Here are some examples of MACD parameters, with “12, 26, 9” being the most widely used:
Faster-moving average:
“12” represents the previous 12 periods, which could be days or any other time frame.
- Slower-moving average: “26” represents the previous 26 periods.
- Difference between the faster and slower moving average:
- “9” represents the previous 9 periods’ moving average or the gap between the fast and slow moving averages (shown in the chart above as vertical lines called histograms, highlighted in red).
Calculation:
To calculate MACD:
- MACD Line: Subtract the 26-day exponential moving average (EMA) from the 12-day EMA.
- Signal Line: Calculate a 9-day EMA of the MACD line.
- MACD Histogram: Measure the difference between the MACD line and its 9-day EMA (Signal Line). If the MACD line is above its Signal Line, it is positive, and if it is below, it is negative.
The MACD Line is derived by subtracting the 26-day EMA from the 12-day EMA, based on the closing price. The 9-day EMA acts as a signal line and aids in identifying trend reversals by plotting it with the indicator. The MACD histogram gauges the discrepancy between the MACD and its 9-day EMA (Signal Line). If the MACD line exceeds its Signal Line, the histogram appears positive, while if the MACD line falls below the Signal Line, it appears negative.
Note that the standard MACD settings are “12, 26, 9,” but you can customize them to suit your objectives and preferences.
Strategies for Trading with MACD
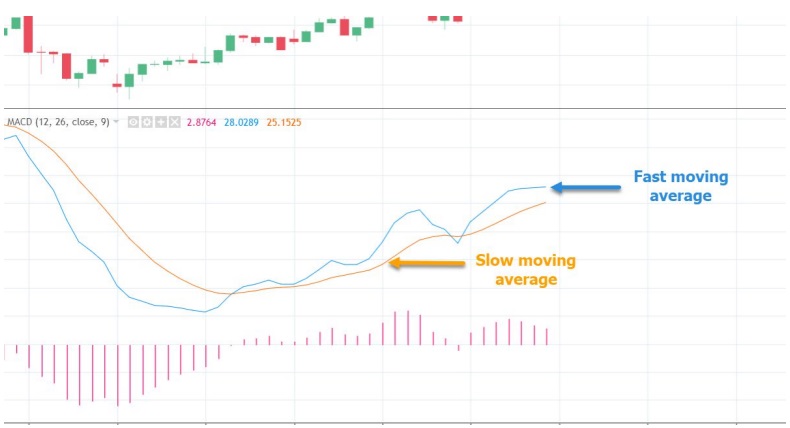
The Moving Average Convergence Divergence (MACD) uses two moving averages that have different speeds. One is quicker to react to price swing movements than the other. When a new trend emerges, the fast line will cross the slower line, causing the fast line to diverge or move away from the slower line, indicating a new trend.
MACD has two terms: Convergence and Divergence. Convergence occurs when the moving averages move towards each other, while divergence occurs when the moving averages move away from each other. There are three ways to interpret MACD:
- Crossovers: A crossover occurs when the MACD line and the signal line cross. The signal line is a 9-day EMA of the MACD line, and it trails the average line. A bullish crossover happens when the MACD crosses above the signal line, while a bearish crossover occurs when it turns below the signal line. This strategy can be used to enter a long or short position or manage/close an existing position.
- Center-line Crossover: A bullish center-line crossover occurs when the MACD line moves above the zero line to turn positive, indicating a buy signal. A bearish center-line crossover occurs when the MACD line moves below the zero line to turn negative, indicating a sell signal.
- Divergence: Divergence occurs when the security price deviates from the MACD, indicating a potential new trend. Positive divergence occurs when the MACD fails to confirm a new low in the security price, while negative divergence occurs when the MACD fails to confirm a new high in the security price. Positive divergence forms when the security records a lower low and the MACD creates a higher high, while negative divergence takes place when the security records a higher high and the MACD creates a lower low.
The Most Popular MACD Combination
Combining Moving Average Convergence Divergence (MACD) with Relative Vigor Index (RVI) helps to determine the strength of a trend. RVI calculates the closing price of a security and compares it to its price range, smoothing the results with EMA. The goal of combining these tools is to match crossovers, meaning if one indicator has a crossover, you wait for a crossover in the same direction from the other indicator. Once this occurs, you can buy or sell the equity and hold your position until the MACD gives a signal to close the position. The chart above shows the 60-minute chart of Citigroup from December 4-18, 2015, where two short and one long setup occur after a crossover between the MACD and the RVI. Green circles indicate crossovers, and red circles indicate where the position should have been closed. By using this strategy, you could have gained a profit of $3.86 per share with those three positions.
Combining MACD with Money Flow Index (MFI)
The Money Flow Index (MFI) is an oscillator that measures buy and sell pressure using both price and volume. It provides fewer buy and sell signals compared to other oscillators because it requires both price movements and volume surges to make extreme readings.
One strategy is to combine the MFI with the MACD and use overbought/oversold signals produced by the MFI for trading. If the MFI indicates a bearish crossover with the MACD lines, a potential short trade may be taken, while a bullish crossover can be taken as a long trade.
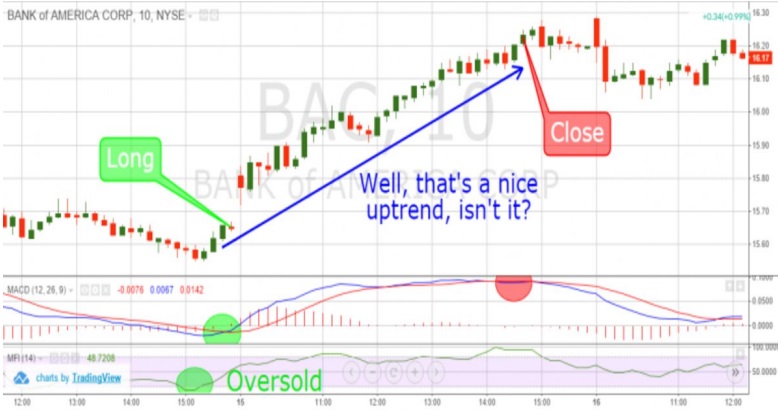
For instance, on the 10-minute chart of Bank of America (BAC) shown above, the green circle indicates an oversold signal from the MFI. After 30 minutes, the MACD generates a bullish signal, indicating a potential long position at the green circle highlighted on the MACD. The position is held until the MACD lines cross in a bearish direction, as shown in the highlighted red circle on the MACD.
Overall, this position results in a profit of 60 cents per share over approximately 6 hours.
Combining MACD with Triple Exponential Moving Average (TEMA)
The Triple Exponential Moving Average (TEMA) is a tool that is used to eliminate market volatility from traditional moving averages. It consists of a single exponential moving average, a double exponential moving average, and a triple exponential moving average.
A trading signal can be generated when the fast line crosses the MACD, and the price of a security breaks through the TEMA. Exiting positions is necessary whenever there are conflicting signals from both indicators.
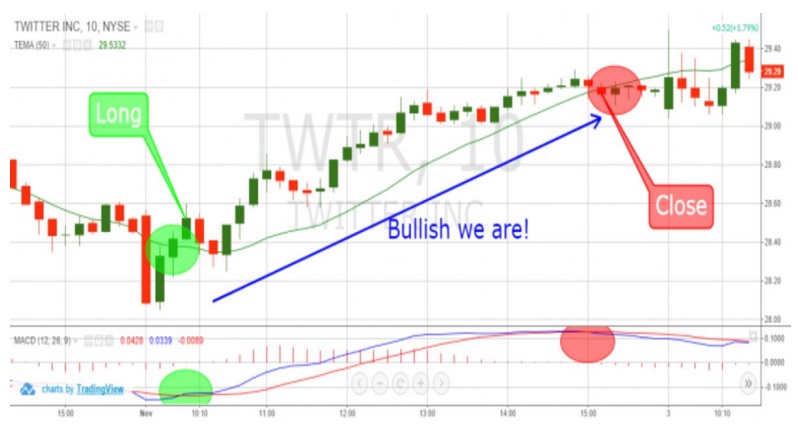
The chart below shows the 10-minute chart of Twitter. The first green circle represents the moment when the price crossed above the 50-period TEMA. The second highlighted circle represents a bullish TEMA signal confirmed by the MACD, which is when you should open a long position.
As seen in the chart, the price of Twitter increases, and the first closing signal from the MACD occurs after approximately 5 hours. After 20 minutes, the price of Twitter breaks the 50-period TEMA in a bearish direction, and you should close your position. This trade generated a profit of 75 cents per share.
Combining MACD with Triple Exponential Average (TRIX)
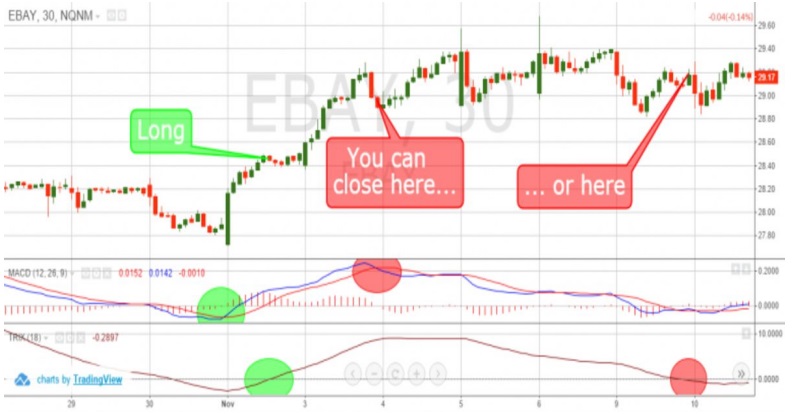
The Triple Exponential Average (TRIX) is an oscillator that serves as a momentum indicator for identifying overbought and oversold markets. There are two exit strategies that can be used with this strategy. The first option is to exit the market when the MACD makes a cross in the opposite direction after the trigger line breaks. This is a tighter and more secure exit strategy. The second option is to exit the market when the MACD makes a cross that is followed by the TRIX breaking the zero line. This strategy is riskier because you are in your position until the zero line of the TRIX is broken, which could take some time in the event of a significant change in trend.
The chart above shows the 30-minute chart of eBay. The first green circle is a long signal from the MACD, and the second highlighted green circle is when the TRIX breaks zero and you enter a long position. Conversely, the two red circles show contrary signals from each indicator. In the first case, the MACD gives you the option for an early exit, while in the second case, TRIX keeps you in position. Using the first exit strategy would have resulted in a profit of 50 cents per share, while the alternative approach would generate a profit of 75 cents per share.
Combining MACD with Awesome Oscillator (AO)
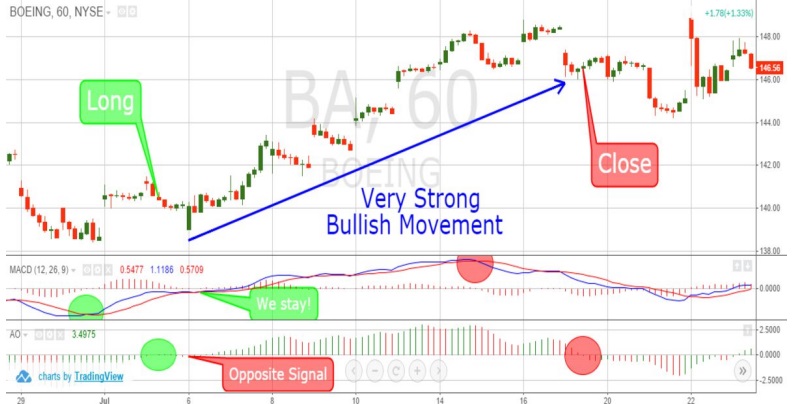
The purpose of the Awesome Oscillator is to measure market momentum by calculating the difference between the 34 and 5-period Simple Moving Averages. The strategy suggests entering and exiting the market only when a signal is received from the MACD, confirmed by the Awesome Oscillator.
The chart displayed above is the 60-minute chart of Boeing. The two green circles highlight moments when you should open a long position. However, the Awesome Oscillator generates a contrary signal after going long. Nevertheless, since the MACD does not produce a bearish crossover, you remain in your long position. The first red circle highlights the moment when the MACD has a bearish signal. The second red circle highlights the bearish signal generated by the AO, and you close your long position. In total, this long position generated a profit of $6.18 per share.
Recap and Conclusion
The main advantage of the MACD indicator is its ability to integrate momentum and trends into a single indicator. As mentioned earlier, this is accomplished by calculating the difference between two moving averages. Consequently, the values of the MACD rely on the price movements of the underlying security and the implementation of other strategies, such as technical analysis, can enhance its effectiveness.