
Many indicators have been developed to help with chart pattern validation or to produce customized buy and sell signals for technical investing research. The stochastic oscillator is an important tool to take into consideration if your goal is to pinpoint the end of a trend. Below is a list of the most important information concerning stochastic oscillators.
Table of Contents
- Stochastic Oscillator: An Overview
- Stochastic Oscillator Signals
- Using Stochastic Oscillator for Trend Following
- Stochastic Oscillator in Strong Trends
- Breakout Trading with Stochastic Oscillator
- Identifying Trend Reversals with Stochastic Oscillator
- Understanding Divergence with Stochastic Oscillator
- Choosing the Right Stochastic Settings
- Markets Suitable for Stochastic Oscillator
- How to Incorporate Stochastic Oscillator in Trading Strategies
- Utilizing Stochastic Oscillator with Price Action and Other Indicators
- Combining Stochastic Oscillator with MACD
- Enhancing Trading Strategies with Stochastic Oscillator and RSI
- Summary
Stochastic Oscillator: An Overview
The stochastic oscillator, first developed in the 1950s, measures momentum by examining the relationship between a security’s closing price and its price range over a given period of time. By comparing a security’s closing price to its price range, traders can use the stochastic oscillator to determine the best timing to purchase or sell assets and anticipate price changes. Support and resistance levels are also incorporated into the indicator to help with these forecasts.
Stochastic Oscillator Signals
To find powerful trade signals in the market, the stochastic oscillator can be used in a number of ways, including:
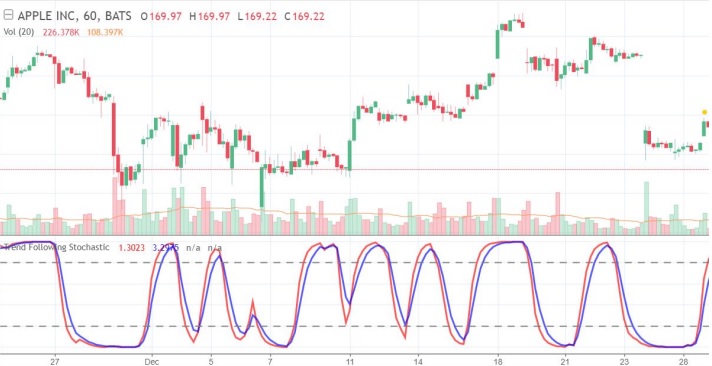
Using Stochastic Oscillator for Trend Following
The trend will continue as long as the stochastic oscillator is crossed in one direction.
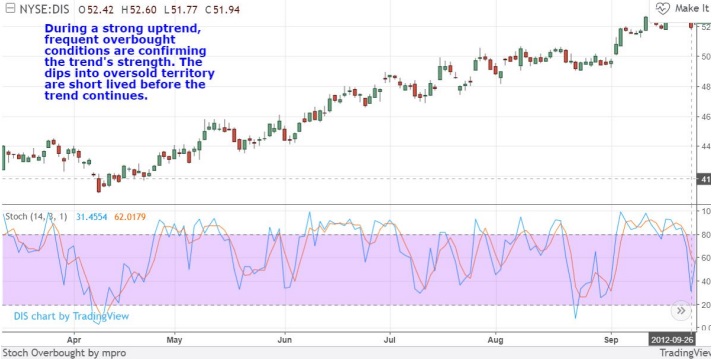
Stochastic Oscillator in Strong Trends
It is advisable to follow the trend and refrain from going against it when the stochastic oscillator crosses into an oversold or overbought region.
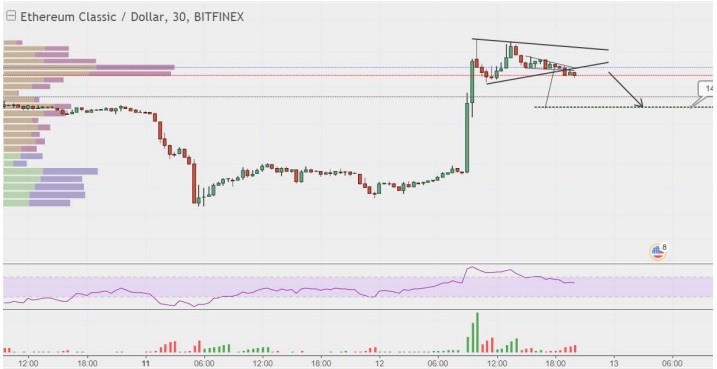
Breakout Trading with Stochastic Oscillator
The beginning of a new trend can be predicted if the stochastic oscillator suddenly accelerates in one direction and the two stochastic bands begin to broaden.
Identifying Trend Reversals with Stochastic Oscillator
The stochastic oscillator may signal a probable reversal if it changes course and leaves the overbought or oversold regions. This can be further supported by combining the stochastic oscillator with moving averages or trend lines, as we will see in a moment.
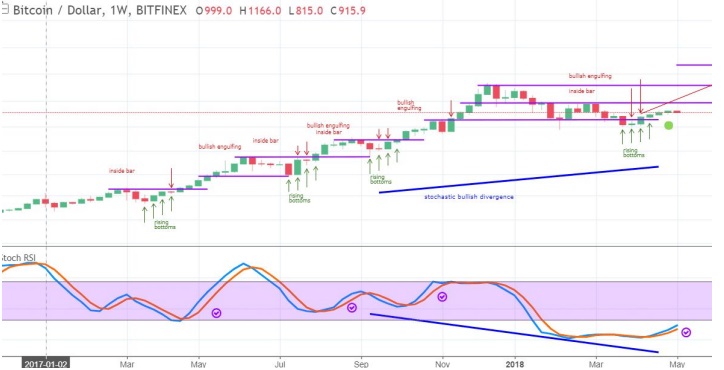
Understanding Divergence with Stochastic Oscillator
When using momentum indicators, divergence is essential in spotting probable trend reversals.
Choosing the Right Stochastic Settings
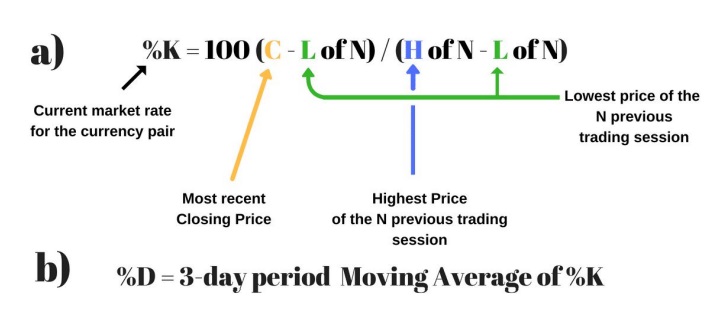
The stochastic oscillator uses a default value of 14 periods, which can be expressed as days, weeks, months, hours, or an intraday time frame. Default value for the %D in the equation is a 3-day simple moving average (SMA). Two numbers, %K and %D, which are used by the stochastic oscillator and are detailed in more detail below, are used.
Markets Suitable for Stochastic Oscillator
The stochastic oscillator performs well in a range market as opposed to a surging market. Lagging indicators like the MACD, which can keep traders in a trend as long as the trend is feasible, are necessary for trending markets. Moving averages, however, can flatten in a sideways market, providing little meaningful data. Lagging indicators are therefore often viewed as being ineffective in a trading environment. Although oscillators can still generate a higher frequency of buy and sell signals in a range market, the stochastic oscillator is especially helpful in this situation.
How to Incorporate Stochastic Oscillator in Trading Strategies
The stochastic indicator’s original purpose was to track a price’s momentum, but it is now employed to spot overbought and oversold assets. The stochastic is scaled from 0 to 100 to assess if a security is overbought or oversold. The blue line in the graph represents the %K line, and the orange line represents the %D line. When the stochastic lines are over 80 (the green line on the chart), an investment is said to be overbought, which indicates that it is costly and would be a good opportunity to sell.
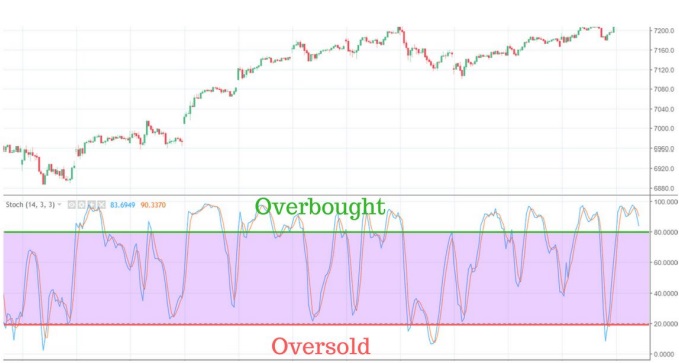
The security is oversold and may be inexpensive and worthwhile to buy when the stochastic lines are below 20 (the red line in the chart). Two numbers—%K and %D—are used to calculate the stochastic oscillator, with default settings of 14 periods for %K and 3 periods for %D. A 3-period moving average of %K is shown by the %D line. To check for variations, these numbers are displayed on a graph between 0 and 100.
Utilizing Stochastic Oscillator with Price Action and Other Indicators
The best method for finding support and resistance levels is to use the stochastic oscillator combined with price action. Traders can use the stochastic indicator as a guide to determine when the markets are overbought or oversold on a one-hour chart, and price action to confirm it on a four-hour chart, in order to identify these levels.
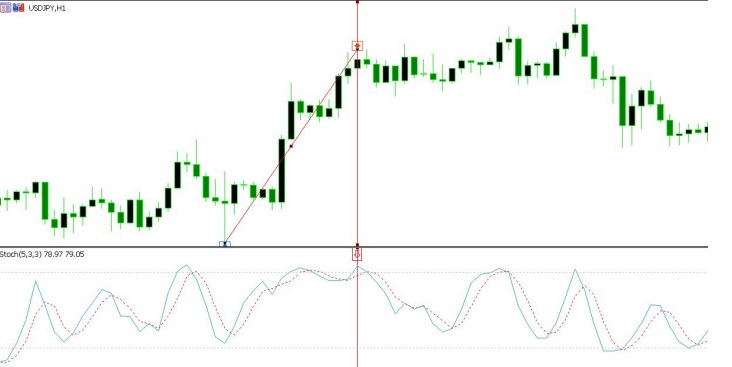
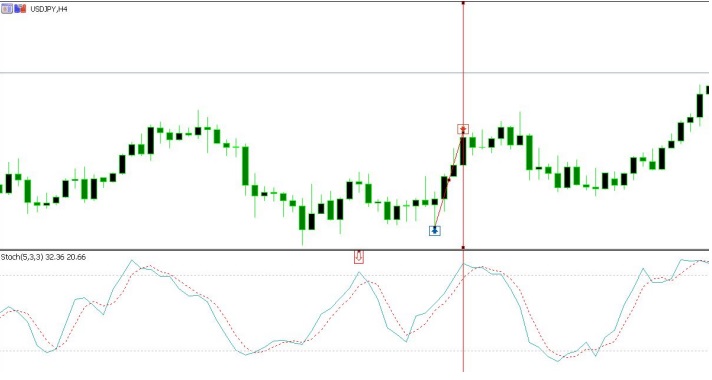
For instance, a swing low and swing high can be seen in the one-hour chart above, and the stochastic indicator shows that the market is overbought. The 4-hour chart then supports this observation.
An overbought condition on both the 1-hour and 4-hour charts indicates a high likelihood setup for traders.
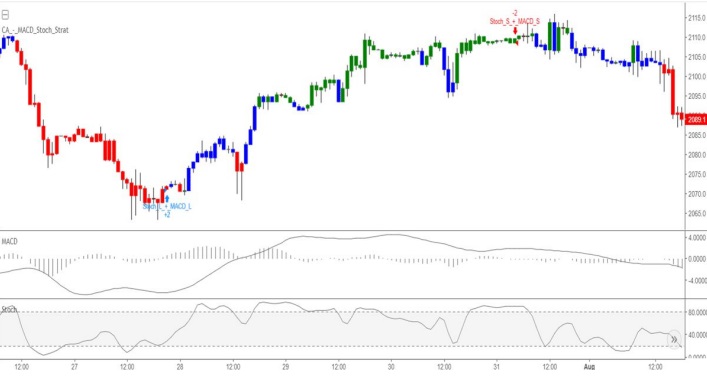
Combining Stochastic Oscillator with MACD
The stochastic oscillator compares a stock’s closing price to its price range over a specified time frame, whereas the MACD, or Moving Average Convergence Divergence, aids in indicating price trends and direction. Because the stochastic compares a stock’s closing price to its price range over time and the MACD measures the convergence and divergence of two moving averages, these two indicators complement one another nicely.
To utilize these two indicators effectively, watch for a bullish crossover to happen within two days of one another, often below the stochastics’ 50-line to signify a lengthier price move. The histogram value ought to ideally rise over 0 within the first two days of the trade.
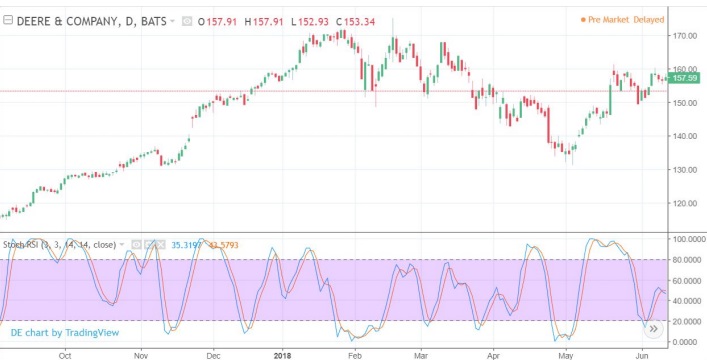
Enhancing Trading Strategies with Stochastic Oscillator and RSI
A technical indicator known as the stochastic RSI combines the stochastic oscillator and the relative strength index (RSI). It functions as a “indicator of an indicator,” increasing sensitivity and producing more signals than the standard RSI indicator. Instead of using regular price data, the stochastic oscillator’s formula is used to calculate a series of RSI values, which produces a line that fluctuates between 0 and 1.
The formula below is used to determine the stochastic RSI:
(RSI – Lowest Low RSI)/StochRSI (Highest High RSI – Lowest Low RSI)
When the indicator’s value falls below 0.20, it is said to be oversold, meaning that the RSI value is trading at the bottom of its range and the underlying security’s short-term trend may be about to undergo a correction. The RSI may be reaching severe levels at a reading above 0.80, which can predict a pullback in the underlying security.
The stochastic RSI is a derivative of price and does not always resemble the price, it is crucial to keep in mind. It offers a more specialized perspective of the RSI and is frequently combined with other technical indicators to confirm indications.
Summary and Recap
A flexible instrument, the stochastic oscillator can generate trading signals that point to prospective trend reversals. It can be used to spot divergences, overbought/oversold levels, and bullish/bearish trade setups, among other things. The stochastic indicator can be used well, but it takes practice because many traders tend to misread it.