
Bar charts, candlestick charts, and line charts are the three most often used charts for trading in the market. There are, however, lesser-known methods that have proven to be among the best methods for developing a more thorough grasp of the industry. One such method is Heikin Ashi. We shall look into Heikin Ashi’s definition and practical applications in this essay.
Free PDF Guide : Get your Understanding Heikin Ashi: A Guide to Using this Trading Technique
Table of Contents
- What is Heikin Ashi?
- Heikin Ashi vs Candlestick
- Heikin Ashi Calculation
- How to Use Heikin Ashi to Identify Trends and Trend Strength
- Heikin Ashi Trading Strategy
- Heikin Ashi MT4 Indicator
- Heikin Ashi MT5 Indicator
What is Heikin Ashi?
The Japanese word Heikin-Ashi, often spelled Heiken-Ashi, literally translates to “average bar.” This tactic is a useful instrument for spotting market patterns and predicting asset prices in the future. The reading and analysis of market trends are made easier by the Heikin Ashi approach, which can be employed separately or in conjunction with candlestick charts. The Heikin Ashi assists traders in deciding when to hold onto a trend trade and when to cut losses if the trend has changed. Accurately anticipating market trends is essential because traders profit when markets are trending.
Heikin Ashi vs Candlestick
Heikin Ashi and the traditional candlestick chart have some significant differences. Traditional candlesticks’ alternating red and green candle colors, which signify upward and downward movement, might be difficult for some traders to understand. The Heikin Ashi chart, on the other hand, has a greater number of successive candles of the same hue, which makes it simpler for traders to identify historical price patterns and present trends. The Heikin Ashi chart typically remains green during an uptrend and red during a decline. Traditional candlestick charts, on the other hand, may show several colors even when the price is strongly moving in one direction but just marginally falling within a session. The way that prices are displayed on the two charts is another significant distinction. Traditional candlesticks start at the point where the preceding candlestick closes, whereas Heikin Ashi candles start in the middle of the candlestick.

Heikin Ashi Calculation
Heikin Ashi charts have certain characteristics with traditional candlestick charts. The open-high-low-close (OHLC) candle is used in both kinds of charts. However, the Heikin Ashi approach makes use of a close-open-high-low (COHL) formula that is modified as follows:
(Open + Close + Low + Close) Equals 14 of a close (This denotes the average price of the current bar)
Open = 12 (Previous Bar’s Open plus Previous Bar’s Closing) (This represents the midpoint of the previous bar)
Max [High, Open, Close] is high.
(This represents the high, open, and close variable’s highest value.)
Min [Low, Open, Close] = Low
(This represents the low, open, and close variables’ lowest values.)
How to Use Heikin Ashi to Identify Trends and Trend Strength
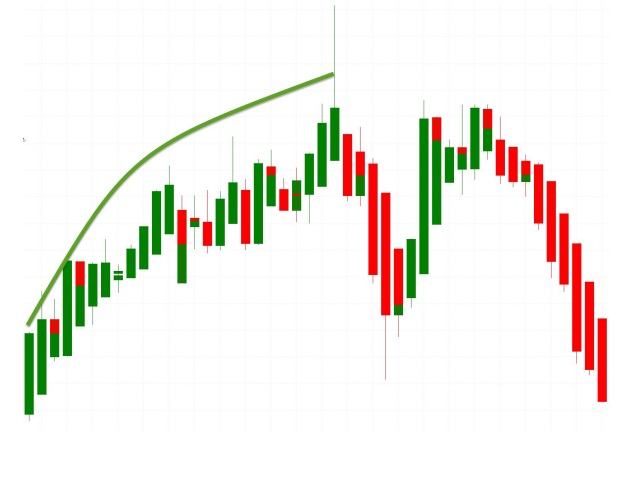
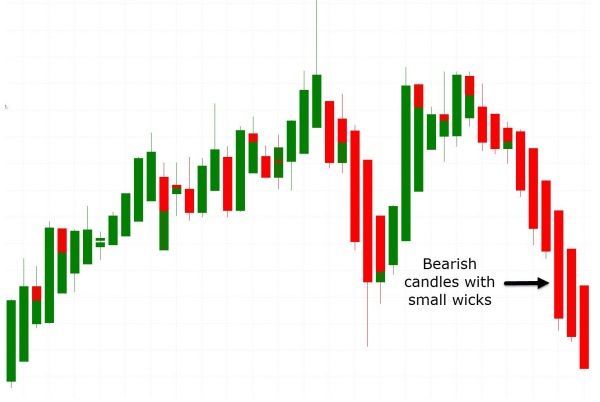
Heikin Ashi candlesticks typically have shorter shadows or wicks than conventional candlesticks because of their averaging technique. Yet, just like with conventional candlesticks, a shorter shadow or wick in a Heikin Ashi candlestick denotes a stronger trend.
Heikin Ashi employs colored candles to indicate a trend’s direction. A downturn is implied by a red candle, whereas an uptrend is implied by a green candle. Strong uptrends are indicated by green candles without upper shadows, and strong downtrends by red candles without lower shadows. The number of consecutive green or red candles, as well as the size of the candles’ shadows or wicks, are further indicators of trend strength in a Heikin Ashi chart.
When evaluating trend strength using a Heikin Ashi chart, the essential thing to look out for is the appearance of “shaved candles,” which are candles without a wick or shadow on one end. Each kind of shaved candlestick has a distinct name depending on which end is devoid of the shadow.
Heikin Ashi Trading Strategy
The Heikin Ashi trading approach, which differs from typical candlestick charts in some ways, is a potent instrument for assessing market activity and forecasting asset prices. Its benefit is that it offers a condensed, information-free perspective of market trends.
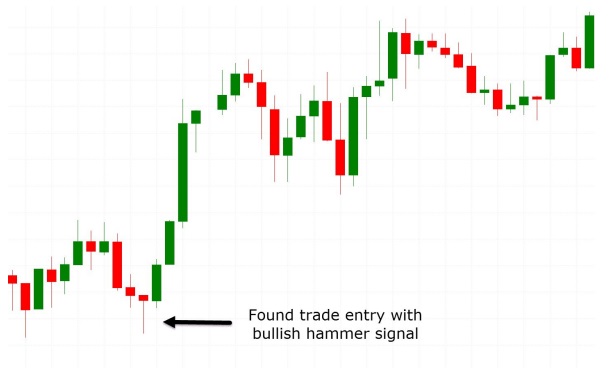
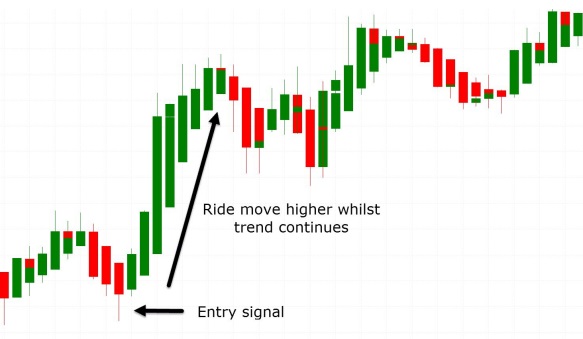
Consider a straightforward scenario where a bullish hammer pattern is discovered using conventional candlesticks, signalling a trade to get long. This will demonstrate the efficiency of the Heikin Ashi method. The Heikin Ashi chart can be used for trend analysis and trade management after the trade has been placed. Heikin Ashi candles on this chart, which shows the same asset and timeframe, make it simpler to determine the trend’s direction.
Heikin Ashi MT4 Indicator
You can choose the chart parameters for the Heikin Ashi MT4 indicator, which is offered by MetaQuotes without charge, to control how the chart is shown. Options for the charts include both line graphs and colors. The indicator may be used on any market or Forex pair, and you can choose the time window you want to look at. Engaging in practical experimenting with the Heikin Ashi MT4 indication is the most efficient way to understand it.
Heikin Ashi MT5 Indicator
Users of the MT5 platform can also get a free Heikin Ashi indication from MetaQuotes. Although this indication looks like a candlestick chart, there are some key differences. The shadows of the candlesticks in the Heikin Ashi MT5 indicator determine their hue. The best way to become familiar with this indicator, like with the MT4 indicator, is to practice using it on demo charts.