A useful tool in the trading sector is the Fibonacci sequence, a mathematical arrangement of numbers in which each next number equals the sum of the two before it. It is frequently used to assess financial assets including stocks, futures, commodities, and cryptocurrencies in Forex and other CFD trading. The Fibonacci levels, which include retracements, targets, and extensions, are effective technical analysis tools because they offer distinct levels of support and resistance that are simple to recognize. They are helpful in identifying high probability trades and deciding whether to take profits because they provide clearly defined entry and exit points. To help traders maximize their returns, this essay will examine numerous Fibonacci retracement trading strategies.
Free PDF Guide : Get your How to Use Fibonacci Retracement in Trading: Strategies and Tips
Table of Contents:
- Understanding Fibonacci Retracement Trading
- Utilizing the Fibonacci Retracement Tool in Meta trader
- Adjusting Fibonacci Retracement Settings
- Applying Fibonacci Extensions
- Implementing a Simple Fibonacci Retracement Strategy
Understanding Fibonacci Retracement Trading
Based on the mathematical links between the numbers in the Fibonacci sequence developed by mathematician Leonardo Fibonacci in the 13th century, Fibonacci retracements are a common technique employed by technical traders.
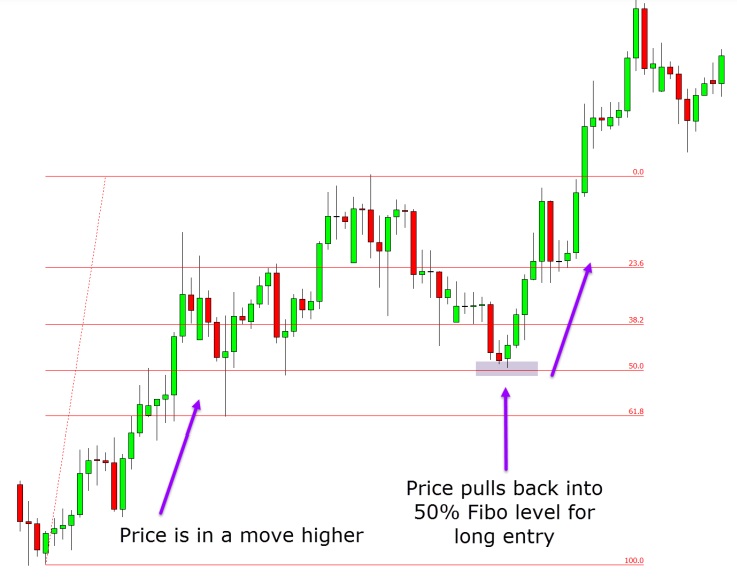
Traders utilize the Fibonacci retracement method in the Forex and other trading markets by choosing two extreme positions, typically a swing high and a swing low, and reducing the vertical distance by significant Fibonacci ratios like 23.6%, 38.2%, 50%, 61.8%, and 100%. These ratios are then employed to create horizontal lines that make it simpler to spot potential support and resistance levels and entry and exit points on a chart. Trading professionals can enter and exit the market with more precision by using Fibonacci retracements. For instance, price may be in an uptrend before retracing to the 50% Fibonacci level, offering a potential chance for long trade entry.
Utilizing the Fibonacci Retracement Tool
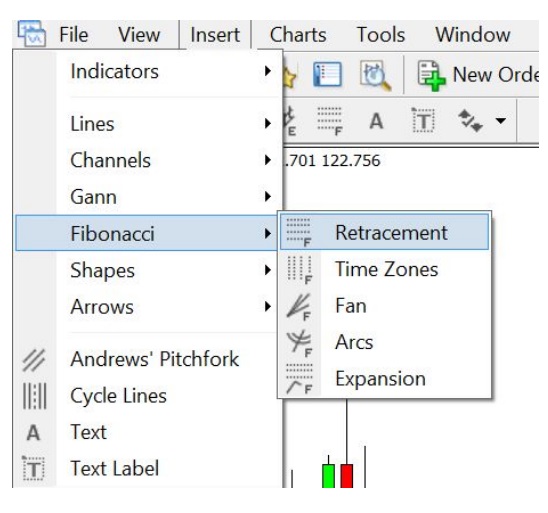
Follow these easy steps to use the Fibonacci retracement tool on your charts:
- Start your trading platform, either MT4 or MT5.
- Choose Insert -> Objects -> Fibonacci from the menu.
- The Fibonacci indicator should be used.
- Go to your chart after selecting Fibonacci Retracement. Your Fibonacci levels can be modified on the Meta Trader chart.
- In order to plot your Fibonacci levels on the graph, click and hold the mouse button.
- Remember that you can adjust and personalize the Fibonacci levels and descriptions to suit your tastes.
Adjusting Fibonacci Retracement Settings
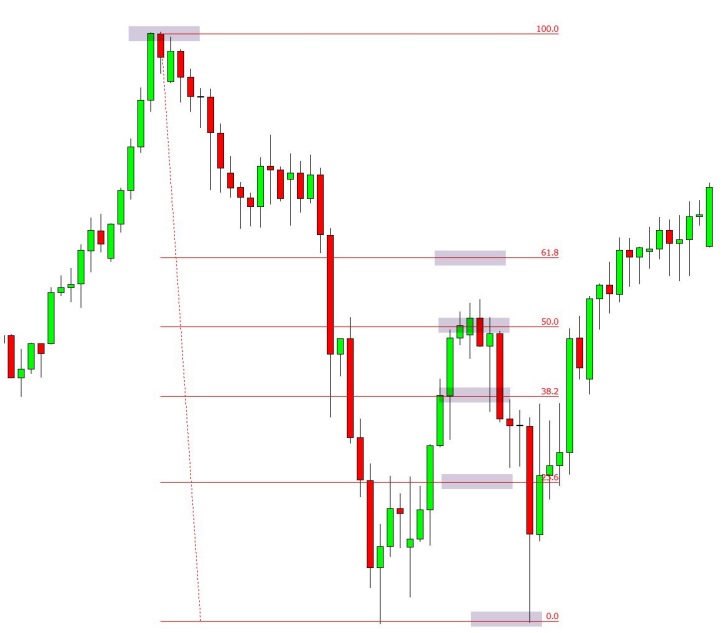
Horizontal lines known as Fibonacci retracement levels on a chart indicate potential locations of support and resistance. These levels, which are based on Fibonacci ratios, are accompanied with a percentage that represents the price’s percentage retracement of the prior move. The Fibonacci retracement levels that are most frequently employed in trading are 23.6%, 38.2%, 61.8%, and 78.6%; however, some traders also use 50% as a ratio. These settings are crucial because they can be placed between two critical price points, such as a low and a high, and they aid traders in determining when to enter and quit a transaction.
Applying Fibonacci Extensions
During a price retracement or retreat in an asset, traders can utilize Fibonacci extensions to identify potential profit targets and reversal locations. In the forex market and other financial markets, these levels also aid in the establishment of zones of support and resistance. While the Fibonacci retracement levels are used to determine entry and exit points in a trend, the Fibonacci extension levels are often utilized to determine how far an asset’s price can rise following a retracement.
A crucial number in the Fibonacci sequence, the Golden Ratio of 1.618 serves as the foundation for the highest Fibonacci extension level, the 161.8% level. In order to predict how far the trend will advance before reaching its top, or the 161.8% level, traders seek to enter at the bounce point in an uptrend. When the market is in a downtrend, traders try to buy at a point of correction while monitoring the recent retracement to gauge how low the trend could go before reaching the 161.8% level, which marks the bottom.
A counter-trend trade can also be entered at the 161.8% extension level, however this strategy is not suggested for novice traders. Traders choose three points on a chart and draw lines at the percentage points of the move to apply Fibonacci extensions. The beginning of a move is shown by the first point, the finish of the motion is shown by the second point, and the retracement against the move is concluded by the third point.
Implementing a Simple Fibonacci Retracement Strategy
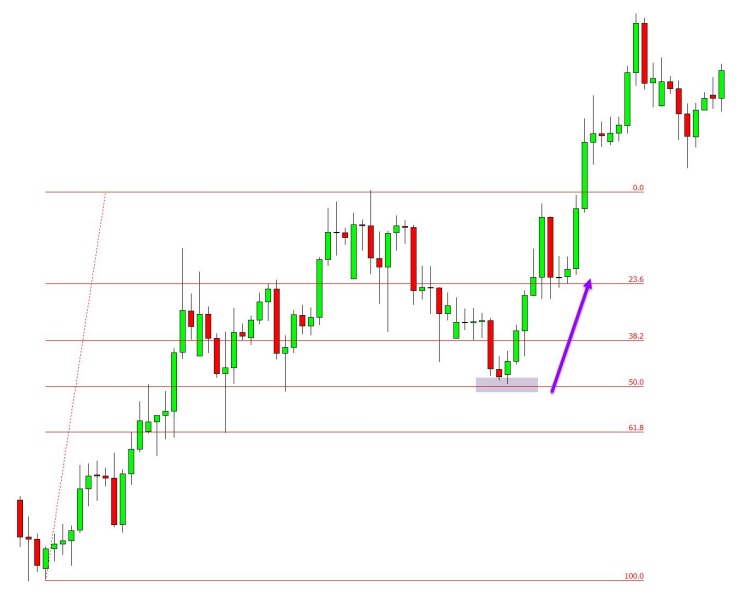
Trend traders who see a retracement within a trend frequently employ the Fibonacci retracement approach. They locate low-risk entry points into the trend’s direction using Fibonacci levels. Some traders predict a price reversal from the Fibonacci levels and a continuation of the trend for the asset.
For instance, trend traders may search for long trading opportunities if an asset’s price is moving upward. They can see that the price has returned to the 50% retracement level using the Fibonacci tool, which suggests potential long trading chances to ride the trend.