
Same rules apply to supply and demand in real-world transactions as they do in FX trading. The concept is not complicated, despite attempts by certain trading websites to oversimplify it. The capacity to swiftly and reliably identify supply and demand levels in order to identify and handle trades is essential for efficient use of these levels. We will give a comprehensive review of supply and demand in this post, as well as how you can use it to improve your trading tactics.
Free PDF Guide : Get you Mastering Supply and Demand in Forex Trading: A Comprehensive Guide
Table of Contents
- Understanding Supply and Demand
- Supply and Demand in Forex Trading: What You Need to Know
- Techniques for Identifying Supply and Demand in the Forex Market
- Leveraging Price Action in Supply and Demand Trading
- Identifying Trading Signals from Supply and Demand Levels
- Effective and Simple Trading Strategies for Supply and Demand
- Lastly
Understanding Supply and Demand
The concept of supply and demand describes the connection between the quantity of an item that is available and the quantity that is sought. In forex trading, supply refers to the amount of a particular asset, product, or currency that is currently in circulation, whereas demand refers to the quantity that consumers are willing to pay for it.
Consider the cost of fuel as a straightforward real-world illustration. Gasoline usually costs less and is more accessible when there is a plentiful supply available. Yet, if demand for gasoline increases and there is less supply available, the price will rise as consumers are ready to pay more to obtain it. Supply and demand can be seen in a variety of situations, from housing pricing to food prices.
Supply and Demand in Forex Trading: What You Need to Know
In both the real world and forex trading, the laws of supply and demand are in effect. A particular currency’s value will rise if there is a great demand for it. On the other hand, if demand declines and there is an excess of something, the price will go down.
A straightforward way to comprehend this is to think about what occurs when prices increase quickly in a bullish market. More traders attempt to enter the market as the price rises (increased demand). The price increases further because the supply cannot keep up with the escalating demand.
To determine supply and demand levels on Forex charts, a variety of methodologies can be used. They include trendlines, levels of support and resistance, and moving average-based dynamic support and resistance. Major support and resistance levels, on the other hand, are the quickest way to spot levels of supply and demand because they denote regular points where the price oscillates back and forth, indicating where overstock and demand exist.
Techniques for Identifying Supply and Demand in the Forex Market
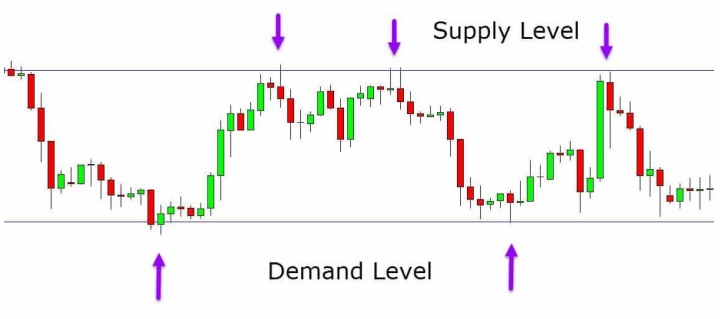
In the world of trading, there is a perpetual battle between buyers and sellers over pricing. This continual conflict aims to establish who has influence over the next market movement, as well as the supply and demand levels.
The sample chart below demonstrates how when prices decline, it denotes an oversupply and insufficient demand, which causes prices to decline. Yet, the market dynamics change and the demand rises when the price reaches a demand level (support). Prices rise again as a result of the supply becoming less available due to the growing demand.
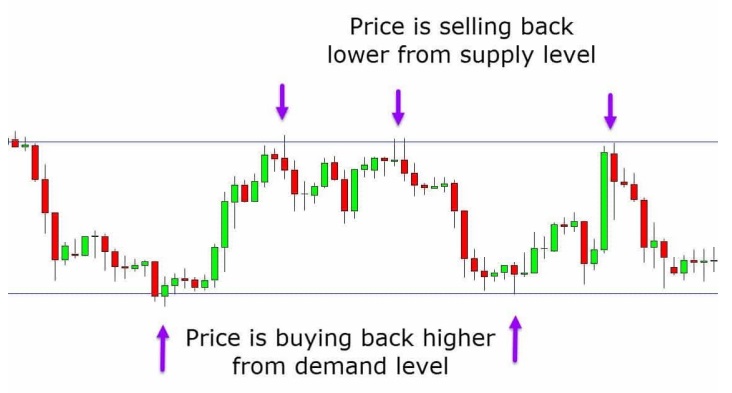
Once the price begins to rise once more, traders start to cash out their winning deals, increasing the supply. The price begins to decline once more when supply exceeds demand.
Leveraging Price Action in Supply and Demand Trading
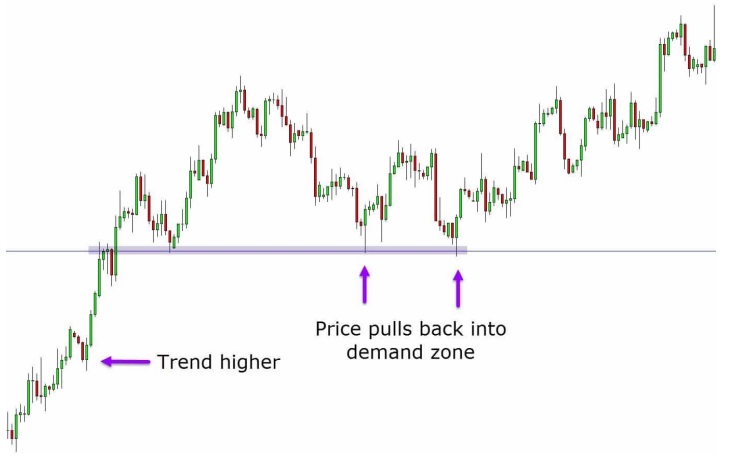
The simplest and most efficient approach to use supply and demand levels in trading is with a clear price action chart. A clean chart shows only the actual price movement, with no indicators or other filler. The price is heading upward in the sample chart below, and two potential trading indications to open a long position are displayed. Before making another significant move higher, the price makes two pullbacks into the same demand zone. The first pullback occurs into a clear demand (support) area where you might enter the market long.
Identifying Trading Signals from Supply and Demand Levels
After mastering the identification of clear supply and demand zones on your charts, you can use them to not only identify high probability trades but also manage them effectively. These levels can be leveraged to create high reward trades and to set stop loss and profit targets. Moreover, you can use them on various timeframes.
Effective and Simple Trading Strategies for Supply and Demand
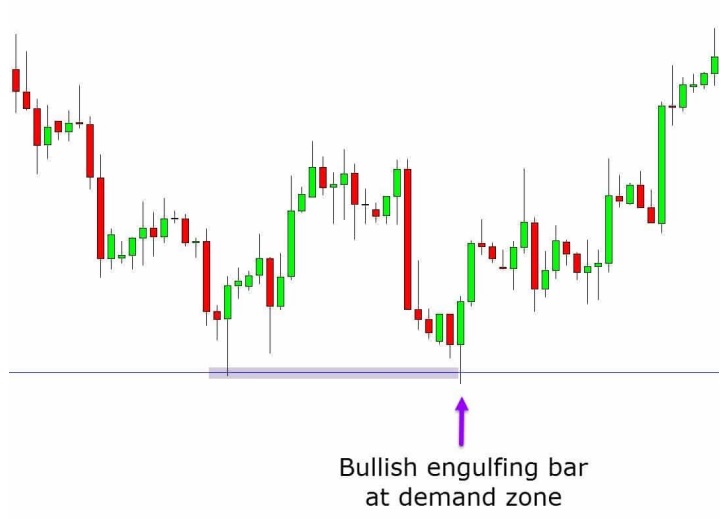
The supply and demand trade examples that follow are recurrent setups that work on all time frames. The first example entails locating a distinct demand level where pricing has repeatedly found support. From this level, more aggressive traders might start a long trade, while more cautious ones might wait for a bullish Japanese candlestick to confirm the trade. In this case, the price creates a bullish engulfing bar at the level of demand, confirming a long trade upward.
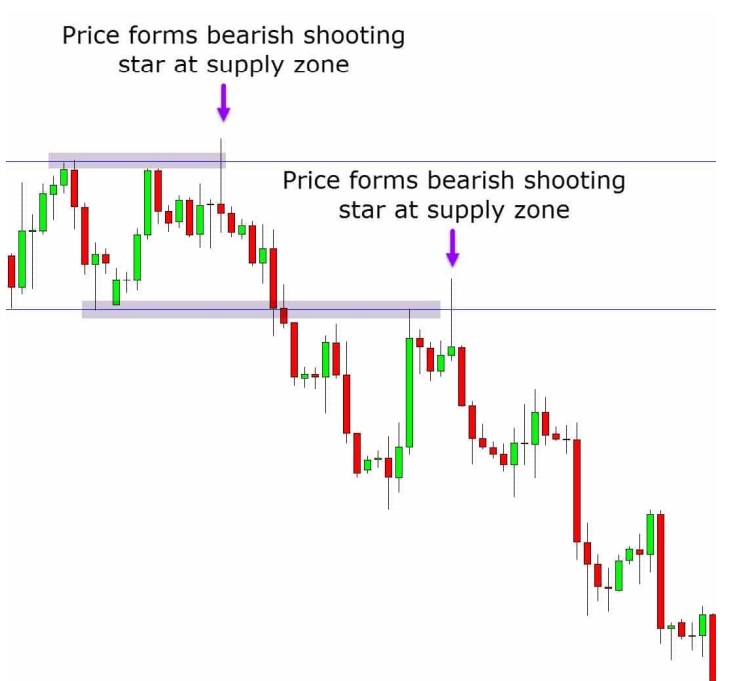
The next supply and demand trade comprises a price trend that declines after breaching a support level. You can think about placing a short trade in accordance with the overall trend when the price retraces back to a supply level. You can also search for a candlestick pattern, such a shooting star formation, to corroborate the bearish move. This technique can be used to consistently find high probability trades across all time frames.
Lastly
It could take some time and effort to accurately detect and use supply and demand levels. Downloading and depending on an indicator that offers trading signals and direction is not as straightforward as it may seem. Nonetheless, there are several advantages to enjoy once you have mastered this trading strategy. It may be used to locate trades across all periods and to help you choose your take-profit and stop-loss levels. Before risking real money, it is crucial to test any new methods on practice charts to make sure they are effective for you and that you feel comfortable employing them.