
In order for markets, including Forex, crypto, and stocks, to experience upward or downward movement, trading volume is essential. Accurately interpreting and analyzing trading volume can increase the likelihood of identifying profitable trades. This article delves into the definition of trading volume and explores various strategies that can be used to incorporate it into your trading practices.
Table of Contents
- What is Volume When Trading?
- List of Volume Indicators
- Buy and Sell MT4 Volume Indicator
- Volume Trading Strategy
- Volume Trading Strategy for Intraday
What is Volume When Trading?
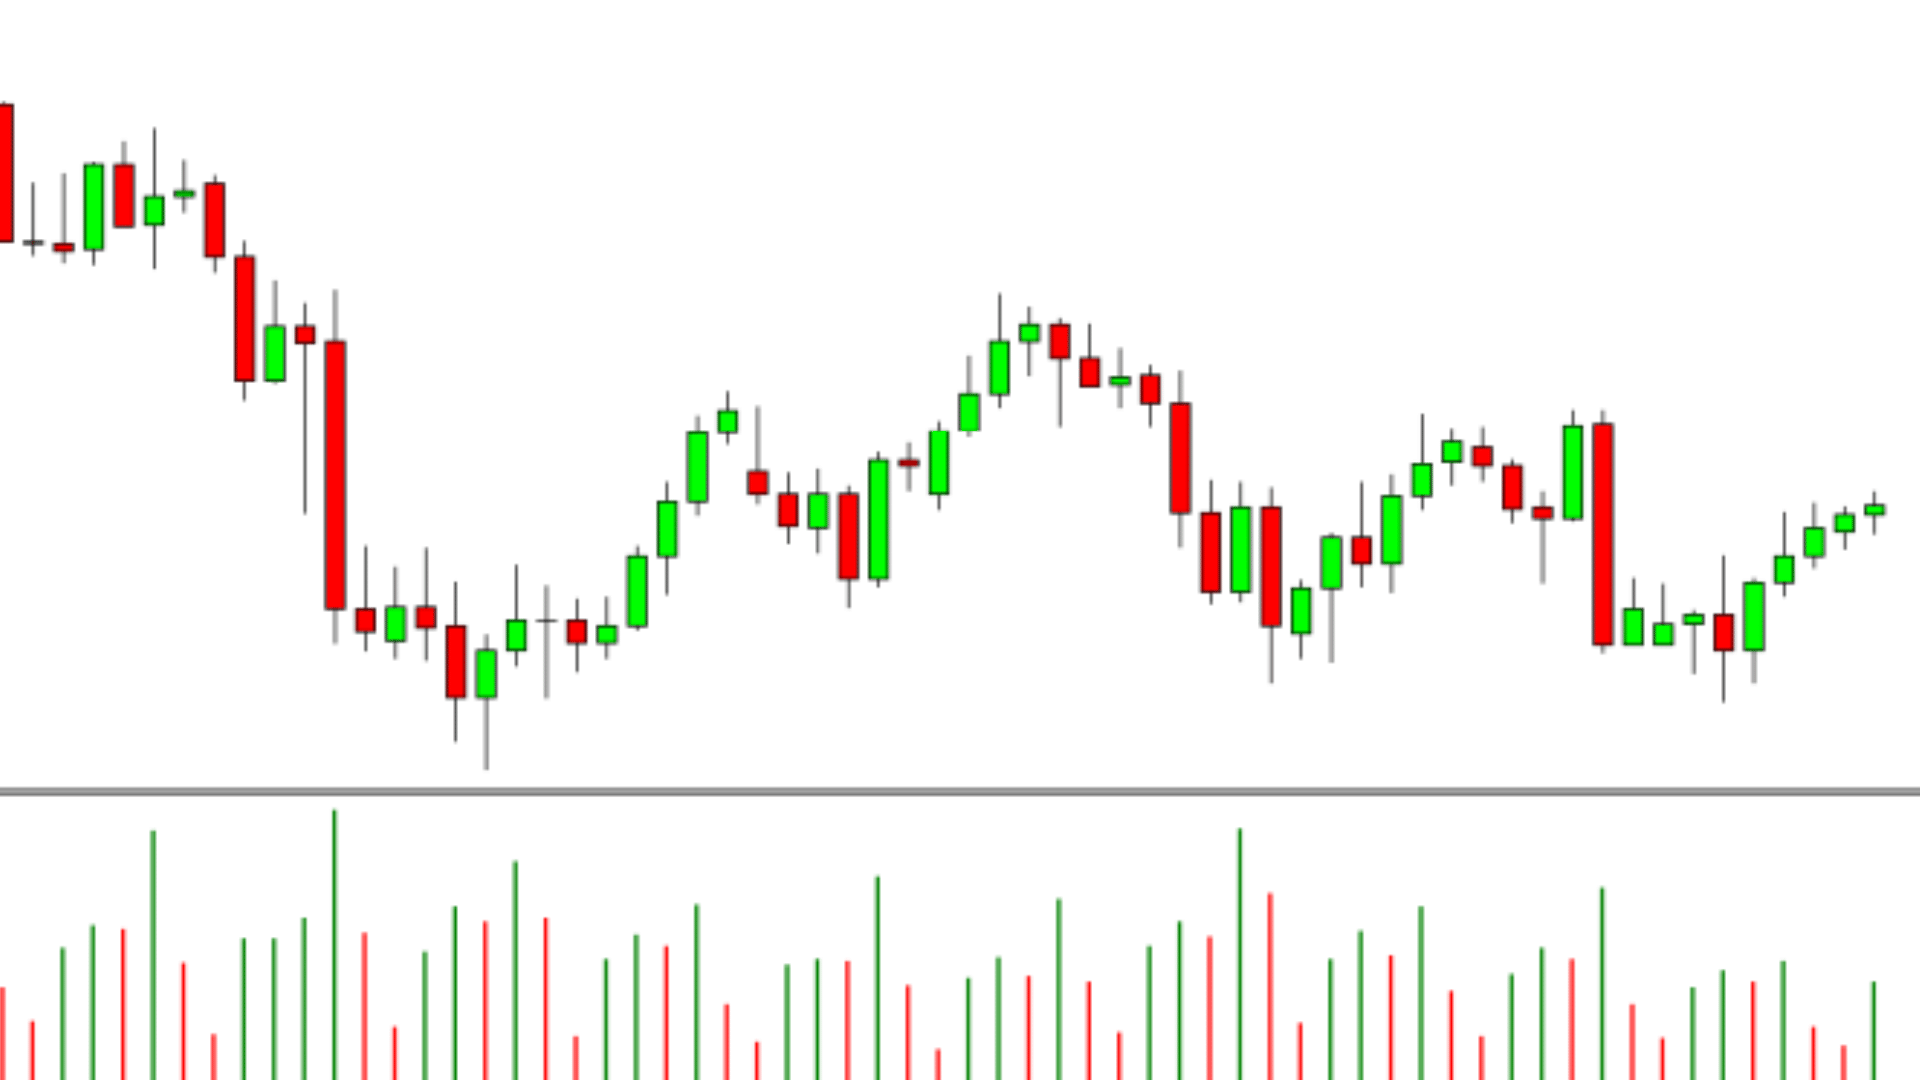
Volume, in its most basic form, refers to the total amount of a particular market that has been traded during a specific period. Analyzing trading volume can be beneficial in identifying and managing trades, as fluctuations in volume can provide insight into the market’s behavior. By analyzing volume information, traders can identify potential opportunities for price movements, breakouts, and even fake outs. While centralized markets such as stocks offer reliable volume data, decentralized markets like Forex have varying volume information as each broker uses different liquidity providers to execute orders. Nevertheless, traders can still obtain a reasonably accurate picture of volume through the use of several key indicators.
List of Volume Indicators
There exist several indicators to analyze volume levels, and four of the most commonly used ones are as follows:
- Volume-Weighted Average Price (VWAP)
- On Balance Volume
- Chaikin Money Flow (CMF)
- Volume Price Trend Indicator (VPT)
On Balance Volume
The On Balance Volume (OBV) indicator is useful in identifying instances where a particular market is experiencing a surge in volume, but the price movement is not significant. It provides insight into the activity of significant market players and whether they are increasing their positions. When institutional investors move into a position, they aim to avoid causing significant price movement, as this could negatively impact their profitability. By analyzing the OBV indicator, traders can identify scenarios where substantial trading volume is occurring, but price movement is not corresponding to the volume.
Chaikin Money Flow (CMF)
The Chaikin money flow indicator is a commonly used tool for analyzing trading volume. Developed by Marc Chaikin, it enables the tracking of volume flow over a specified duration. By using this indicator, one can identify the level of buying and selling pressure during a chosen time frame.
Volume Price Trend Indicator (VPT)
The volume price trend (VPT) indicator is a technical analysis instrument that assists in evaluating the intensity of a price shift. This indicator provides insight into the levels of supply and demand. By multiplying the volume levels with the price shift during a particular time frame, the VPT moves upward or downward, indicating a positive or negative value.
Buy and Sell MT4 Volume Indicator
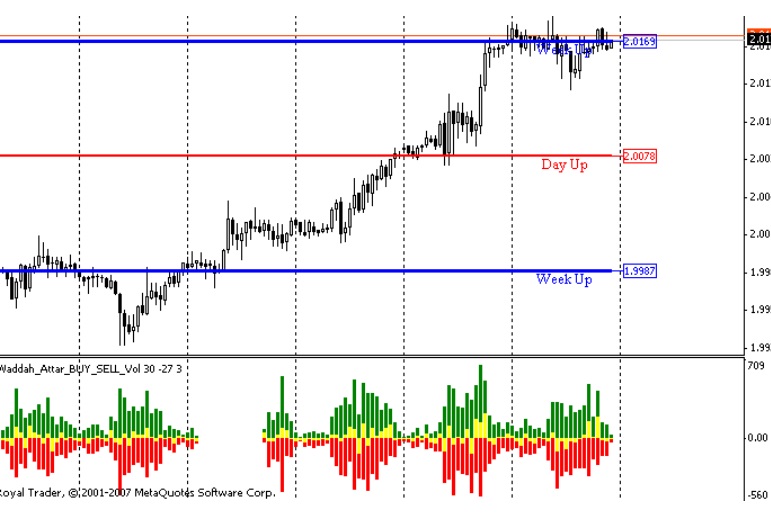
Unlike other indicators that simply provide information about volume levels, this particular MT4 volume indicator employs volume analysis to generate buy and sell signals. Upon adding this indicator to your chart, you’ll be presented with red, green, and yellow levels indicating whether the market is potentially indicating a buy, sell, or hold position.
Volume Trading Strategy
One of the widely used trading strategies involves monitoring price movements to identify when it breaks through significant levels, such as critical support or resistance levels. By utilizing volume information, traders can identify these breakouts and gain additional confirmation.
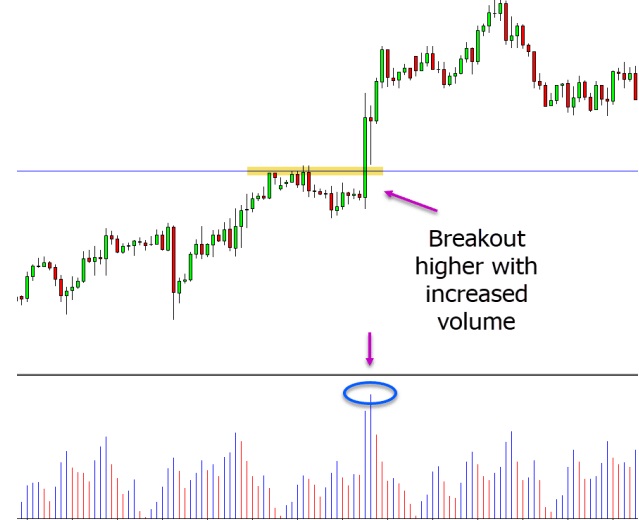
Higher Volume with Breakout
In the given scenario, the price is attempting to break out above a resistance level. To assess the breakout’s validity, traders should observe the volume and ensure that it escalates and maintains a high level both before and during the breakout. Conversely, if the price is breaking out with a low volume, traders should be cautious and consider the breakout as a potential false breakout.
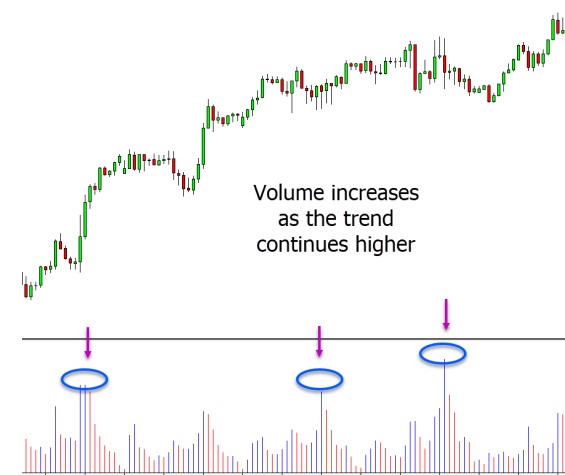
Volume Spike in a Trend
It is essential to monitor volume levels as prices fluctuate during a day or session. In a robust trend, volume levels tend to spike continually as the trend gains momentum, regardless of whether it’s an uptrend or downtrend. For instance, if the price is in an upward trend, traders should observe the volume levels, which are likely to increase as the trend progresses higher, as depicted in the example below.
Volume Trading Strategy for Intraday
Numerous volume indicators are utilized in daily charts, yet certain indicators excel at revealing intraday spikes or declines in volume.
Best Volume Indicator for Intraday
Joseph Granville developed the on balance volume indicator in the 1960s. This indicator calculates higher and lower volume levels to aid in identifying breakouts or fadeouts accurately. It is useful in gaining insight into the actions of significant market players during each session. This indicator adds an oscillator that fluctuates up and down to your chart and is readily available in the indicators section of Meta Trader charts. The underlying concept of this indicator is that volume information typically precedes price movements. Primarily, on balance volume is utilized to detect significant spikes in volume when prices fail to make corresponding large movements, providing clues as to where prices may head next. Typically, major market participants prefer to enter the market when volume levels are low to obtain the best prices, and increased volume may signify an upcoming move.