One of the best methods to improve your chances of success is to trade with the trend. The Average Directional Movement Index (ADX) is a well-liked indicator that is useful as a trading tool since it enables traders to assess the strength of a trend. This article will explain the ADX indicator and show you how to use it efficiently when trading.
Table of Contents
- Introduction
- The ADX Indicator Formula
- Understanding ADX Readings
- Using the ADX as a Trend Strength Indicator
- Average Directional Movement Index Trading Strategy
- How to Use ADX Indicator for Day Trading
Introduction
The average directional movement index was created in the 1970s by J. Welles Wilder. A smoothed moving average is produced by combining two indicators and is shown on your charts. The positive directional indicator (+DI) and the negative directional indicator are the two indicators (-DI). This indicator’s default period is 14, however it may be changed to accommodate other time frames and markets, such as forex, stocks, and cryptocurrencies.
You will notice a single line that spans a value of 0 to 100 along with the +DI and -DI lines after plotting the ADX on your chart. You can easily ascertain whether the price is in a strong trend or range by using the ADX’s fundamental readings. Remember that the ADX is not intended to signal the start of a new trend; rather, it is used to demonstrate the strength of an existing trend.
The ADX Indicator Formula
The +DI and -DI indicators are used to calculate the ADX measurement, with 14 periods being the default. These calculations are based on the price history of the prior high, low, and close for the same amount of periods. It’s crucial to remember that the ADX is used to measure the strength of an existing trend rather than to predict the onset of a new one. Generally speaking, a value below 25 is thought to represent a sideways or range market, while a higher reading beyond 25 denotes a more pronounced trend.
Understanding ADX Readings
The ADX readings can be interpreted as follows:
- 0 to 25: Indicating a ranging or non-trending market
- 25 to 50: Indicating a market that is trending
- 50 to 75: Indicating a strong trend
- 75 to 100: Indicating a very strong trending market.
Using the ADX as a Trend Strength Indicator
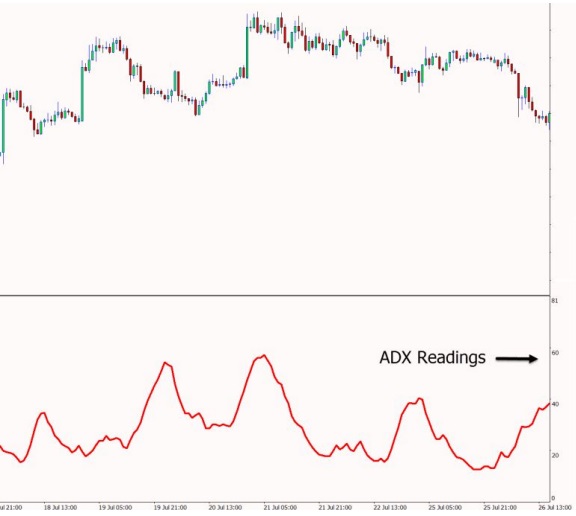
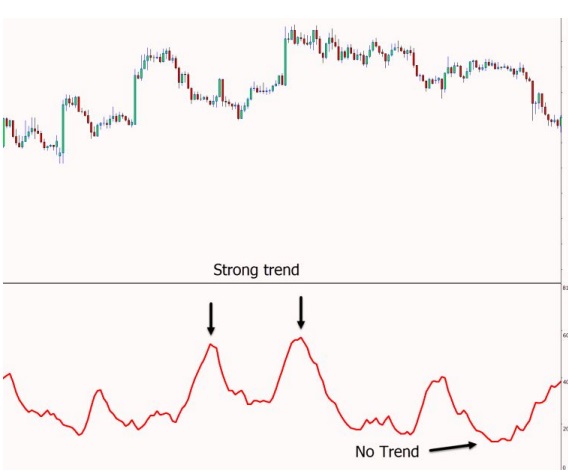
Because it offers a rapid way to assess the strength of a trend on your chart, the ADX indicator is quite helpful. To assess whether the price is in a range or a strong trend phase, you don’t need to perform any complex technical analysis. You simply need to focus on the ADX’s main reading, which graphically illustrates the trend’s momentum through peaks and valleys. The price has little momentum when the ADX shows a string of lower readings, therefore you might want to think about trading something other than trends. Higher readings reveal a stronger moving trend when the readings start to trend higher, it means that the price is trending.
Average Directional Movement Index Trading Strategy
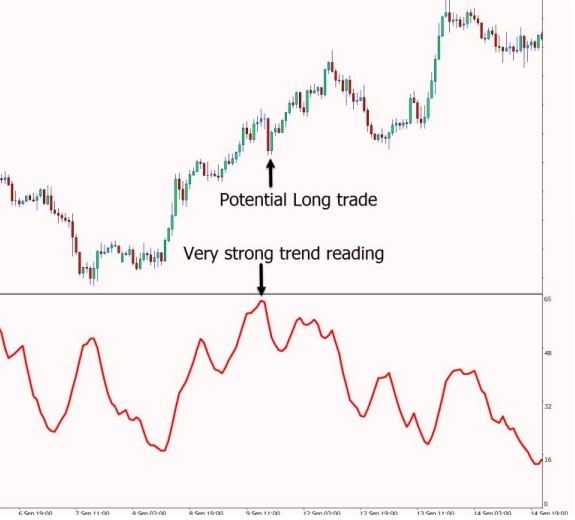
Understanding the strength and momentum of a trend can help traders place trades more likely to succeed. Many traders use this information in both their trading techniques and trade management, such as when to take profits. A trader might think about managing their open transactions, for example, if they are in a trend trade and the ADX starts to fall, going from a strong trend to no longer trending. When the price is in a strong trend and the reading is above 60, for example, the ADX indicator can be used to spot winning trend trades, allowing traders to look for prospective long transactions in accordance with the trend. When the price suddenly swings down, it can be possible to ride the ensuing wave higher.
How to Use ADX Indicator for Day Trading
Because of its adaptability, the ADX indicator can be used on a variety of time frames, including higher time frames and shorter time frames like 5 and 15-minute charts. Day traders now have the chance to spot high momentum and profit from intraday trends. The ADX can help in determining which markets are exhibiting the greatest trends throughout a range of time frames. By examining various time frames, day traders can use the ADX to discover the greatest trading chances. For example, a day trader can find that the EURUSD 15-minute chart is in a trend that is more stronger than the EURUSD 1-hour chart.