
An apparently complex Japanese charting indication called the Ichimoku Kinko Hyo is actually rather simple. Having this indicator on your charts makes it simple to see patterns and prospective trade entries. This post will define the Ichimoku Kinko Hyo, show you how to calculate it, and, most importantly, show you how to use it to find trading opportunities.
Free PDF Guide : Get your The Ultimate Guide to Mastering Ichimoku Kinko Hyo Trading
Table of Contents:
- Introduction to Ichimoku Kinko Hyo
- Identifying Trends with Ichimoku Kinko Hyo
- Trading Strategies using Ichimoku Cloud
- Ichimoku Kinko Hyo Alert Indicator
- Lastly
Introduction to Ichimoku Kinko Hyo
The Ichimoku Kinko Hyo indicator is used to assess the current market trend as well as potential levels of support and resistance. Ichimoku Kinko Hyo, which translates to “one look equilibrium chart,” denotes that all that is needed to determine a market trend and support/resistance levels is a single glance.
The Ichimoku Kinko Hyo is comprised of the following elements:
- Kijun Sen: Often referred to as the basis line or standard line, it is calculated by averaging the 26-period high and low values.
- Tenkan Sen: Often referred to as the turning line or conversion line, it is determined by averaging the highest high and lowest low of the nine preceding periods.
- Chikou Span, also referred to as the lagging line, is determined by graphing the closing price of today 26 periods in the past.
- Senkou Span A, often referred to as Leading Span A, is one of the two clouds that lies in the middle of the conversion and base line. It is the quicker cloud and is plotted 26 cycles in advance.
- The second cloud on the chart is the Senkou Span B, sometimes referred to as the Leading Span B. It is computed by averaging the 52 preceding periods’ highest high and lowest low values, and then plotting those values 26 periods in forward.
Even though it might seem difficult, it’s not necessary to memorize or make notes on these computations. These will be immediately represented on the chart by the indicator. The ability to recognize and trade visual patterns is more important. Three things you must keep in mind are:
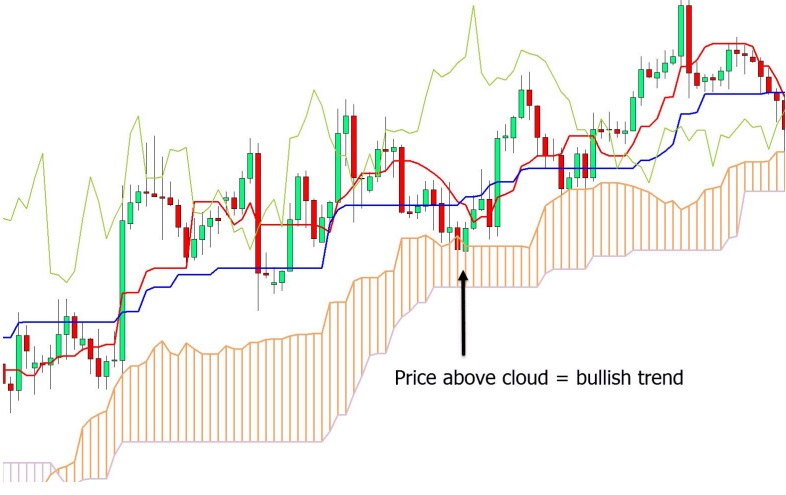
- If the price is above the cloud, there is a bullish sentiment.
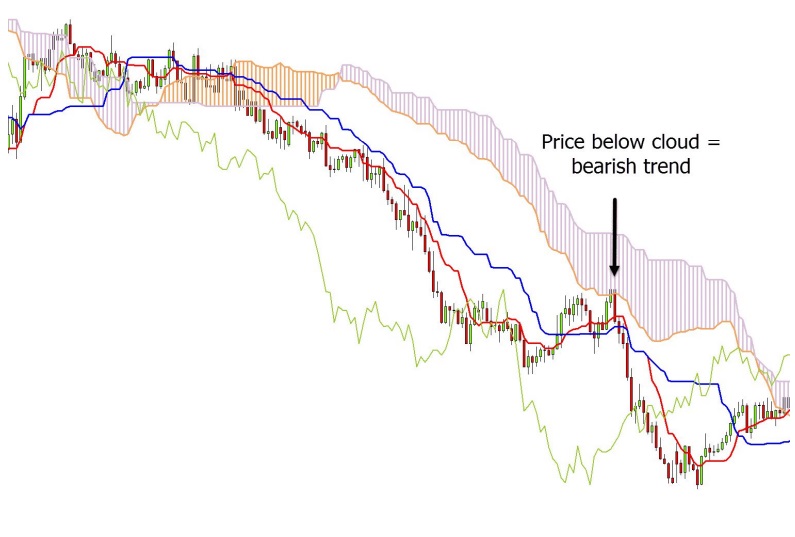
- If the price is below the cloud, there is bearish sentiment.
- The cloud can serve as both resistance and support.
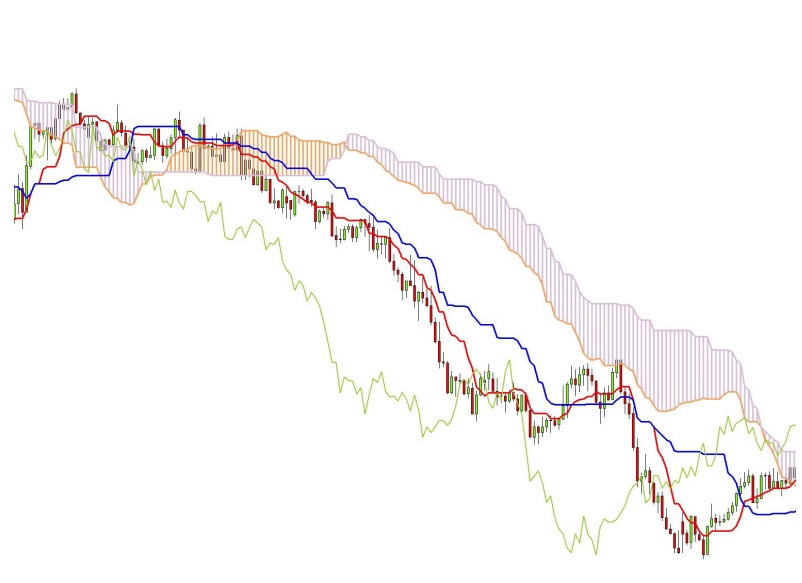
Identifying Trends with Ichimoku Kinko Hyo
After the lines have been drawn on your chart, “clouds” will begin to appear.
You will be able to view the “leading span A” and “leading span B” lines, as was previously said.
Leading span A is deemed to be moving lower with a downtrend momentum when it is situated below leading span B.
On the other hand, the price is heading upwards when leading span B is higher than leading span A.
Both of these clouds can be seen developing on your chart.
You must look at the shape of the clouds and the location of the price in order to rapidly identify the trend utilizing Ichimoku Kinko Hyo clouds. A bullish trend and upward movement are indicated by a price that is above the cloud, whilst a bearish trend and downward movement are indicated by a price that is below the cloud. Remember that you can quickly assess the strength of the trend and momentum by looking at this indicator.
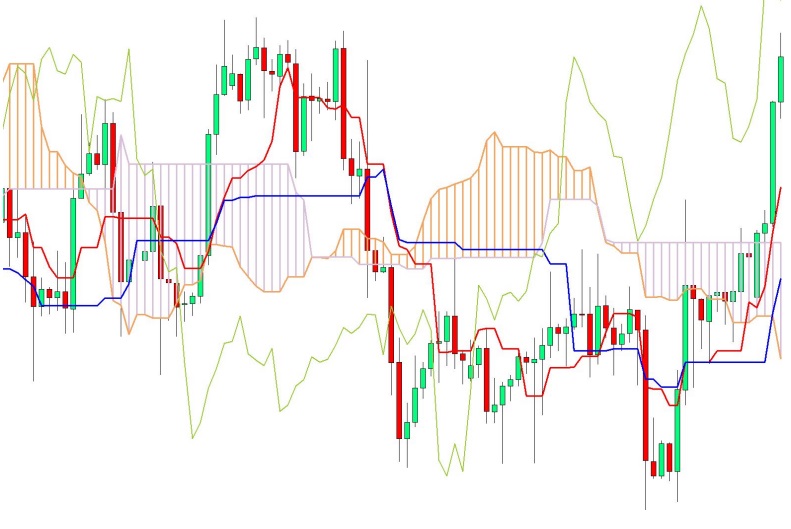
Pay attention to how far away the price is from the cloud and whether or not the clouds are thin and regularly converging. If the clouds are hazy and frequently congregate, it suggests that the market is ranging and the chart is congested. In contrast, when a market is clearly moving, the price will move away from the cloud.
Trading Strategies using Ichimoku Cloud
We can detect and evaluate trends by using the Ichimoku Kinko Hyo indicator, and it can also help us find probable levels of support and resistance for trades. Trading in line with the trend and using the cloud as potential support and resistance levels can both boost the likelihood of success.
Step 1: Determine a Strong Trend
Search for a distinct trend above or below the cloud using the same techniques that were previously covered; ideally, the price should be going away from the cloud.
Step #2: Keep an eye out for a pullback into cloud resistance or support.
Cloud levels frequently serve as important levels of resistance in a downturn or support for trades. In an upswing, keep an eye out for price to retrace to cloud support to consider a potential long entry. Watch for a pullback into the cloud resistance if the trend is down for a potential short trade.
Determine Entry in Step #3
Transactions may be carried out without or with confirmation. Confirmation can boost chances of success and provide transactions with higher chances of success. Using candlestick patterns to find entry signals that can offer a tighter stop loss and a higher risk-reward ratio are examples of confirmation.
For instance, as the price flips into the cloud’s resistance during a decline, a short trade may be initiated. In contrast, price rotating lower towards the cloud’s support could indicate a potential long trade when there is a clear upswing.
When using this tactic, it’s important to be aware of when the cloud is slim or thin. This frequently signals that the price is ready to reverse or break, which is always important to take note of.
Ichimoku Kinko Hyo Alert Indicator
Although many traders are interested in employing the Ichimoku Kinko Hyo indicator, many find it difficult to continuously monitor the market for trade opportunities.
To get around this problem, an alert indicator is helpful.
Since it allows traders to set alerts based on four different methods, the Ichimoku Kinko Hyo alert indicator for MT4 and MT5 is especially useful.
These tactics include the following:
- Tenkan-Kijun Cross
- Kumo Cloud Breakout
- Chikou-Sen Breakout
- Kumo Cloud Future Twist
Lastly
With its various depicted levels and clouds, the Ichimoku Kinko Hyo indication may initially seem difficult to use, but it is actually very straightforward. You can easily master it and see its effectiveness with a little practice. It is crucial to remember that this indicator performs best when used in conjunction with other indications you prefer, Japanese candlesticks, common support and resistance levels, or other confirmation tools.