
With the introduction of trading instruments intended to make currency trading simpler for everyone, the world of Forex trading has seen considerable changes recently. Technical analysis, especially the spotting of chart patterns, has developed into a crucial component of Forex trading, allowing traders to swiftly spot lucrative deals. Harmonic patterns stand out as some of the most often used chart patterns among the many that traders use for technical analysis. Harmonic patterns pinpoint exact market turning points by using Fibonacci numbers. Harmonic trading seeks to predict future movements, which can be difficult for some traders to understand. Some well-known trading strategies concentrate on examining the present price action of currency pairings. Yet, the purpose of this article is to debunk some common myths about harmonic patterns so that traders can use them with confidence.
Free PDF Guide : Get your Mastering Harmonic Patterns: A Guide to Trading Strategies
Table of Contents
- Introduction: Understanding Harmonic Patterns
- The Mechanics of Harmonic Patterns
- Common Types of Harmonic Patterns:
- Gartley Pattern
- Butterfly Pattern
- Crab Pattern
- Bat Pattern
- Shark Pattern
- Cypher Pattern
Introduction: Understanding Harmonic Patterns
Harmonic patterns were initially presented to the trade industry by Harold McKinley Gartley in 1932. These sophisticated trading patterns, which are characterized by geometric price action and Fibonacci levels, naturally appear in financial charts.
Harmonic patterns are trend reversal patterns that rely on geometric constructions, Fibonacci extensions, and retracement levels. They give traders a useful technique to locate significant market turning points and spot probable reversal zones, which can be used to place trades at those points with little risk. Traders can place trades in incredibly profitable reversal zones by precisely spotting high probability harmonic patterns.
Harmonic patterns allow traders to take advantage of profitable market chances by setting up exact entry and exit locations for their transactions. The likelihood of traders succeeding in the markets can be increased by including harmonic patterns into their trading strategy.
The Mechanics of Harmonic Patterns
Harmonic patterns rely on a combination of patterns and mathematical principles to give a precise trading approach based on the idea that patterns repeat themselves. This strategy is based on price/time changes that follow Fibonacci ratio relationships.
Fibonacci ratio analysis may be used for any timeframe chart and is very useful in the currency market. The fundamental idea behind Fibonacci is to use important ratios like 0.618 or 1.618 to locate pivotal retracements, extensions, and high and low points on a chart. Traders can locate crucial price levels to set their stops and objectives by using the projection and retracement levels produced from these swing points.
Harmonic patterns can offer traders a considerable advantage in finding precise entry, stop loss, and target levels by delivering insightful information about prospective price movements and important reversal or turning points. Trading strategies can be enhanced and market success can be increased by utilizing harmonic patterns.
Common Types of Harmonic Patterns:
There are many different harmonic patterns, including:
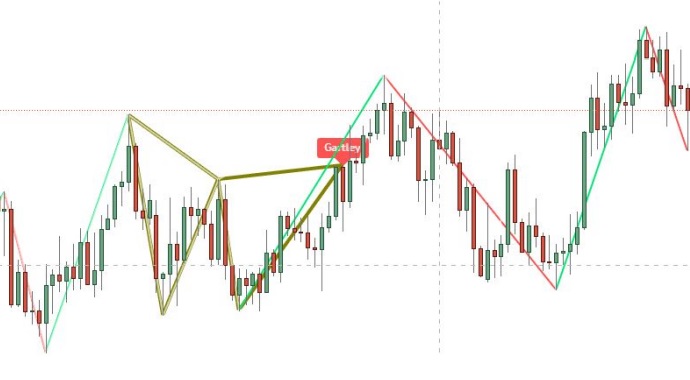
Gartley Pattern
Harold McKinley Gartley invented the straightforward harmonic pattern known as the Gartley Pattern, commonly referred to as the 222 pattern. This pattern is frequently seen during a trend correction and typically occurs after a notable low or high. Whereas the bullish Gartley Pattern resembles an M, the bearish Gartley Pattern has the appearance of a W.
Butterfly Pattern
The Butterfly pattern, created by Bryce Gilmore, is comparable to the Gartley pattern. Whereas the bearish Butterfly pattern signals a potential sell transaction, the bullish Butterfly pattern advises traders to think about purchasing an asset. Finding Butterfly patterns is essential because they can show traders where the current move is likely to terminate.
Crab Pattern
One of the most precise harmonic patterns was created by Scott Carney and is known as the crab pattern. Reversals in the crab pattern closely follow the Fibonacci sequence. The crab pattern is different in size from the butterfly motif despite looking similar.
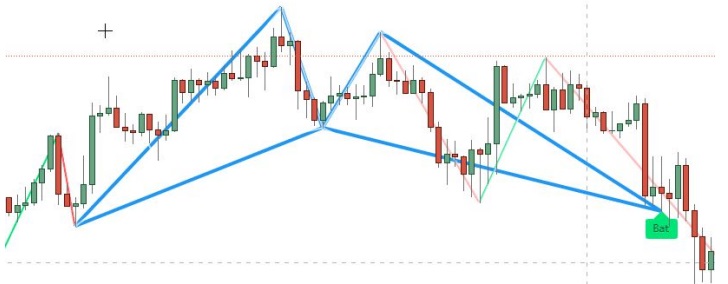
Bat Pattern
The Bat Pattern was created in the early 2000s, according to Scott Carney. The Bat Pattern, like the Gartley pattern, is a continuation and retracement pattern that commonly develops when a trend briefly changes direction before continuing in the same way as before.
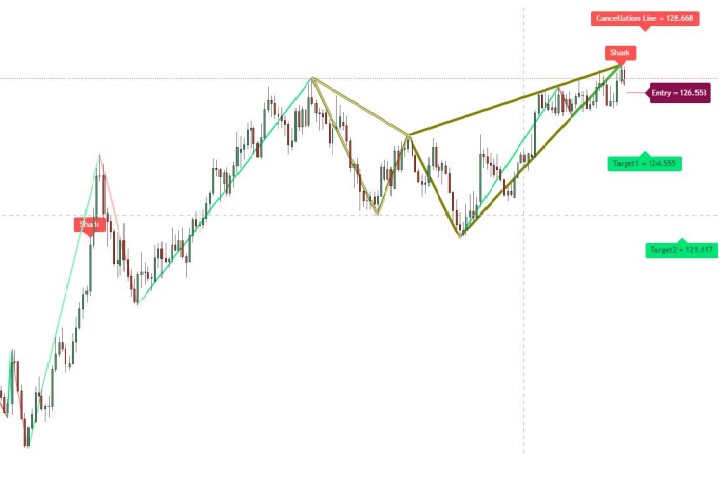
Shark Pattern
Given that it was first found in 2011, the Shark Pattern is one of the harmonic pattern family’s more recent additions. The dorsal fin-like appearance of this pattern on a chart, with high outside lines and a small dip in the middle, gave rise to its name.
Cypher Pattern
Another harmonic pattern that makes use of Fibonacci ratios less than one is the Cypher pattern. Compared to other harmonic patterns, this pattern has a steeper appearance when it forms. It comprises of five contact points and four legs, and the touch points on this pattern represent potential reversal levels.