
To succeed as a trader in the stock market, it is essential to be familiar with the language commonly used by traders and brokers. This article aims to demystify the most frequently used stock market terminology, providing beginner traders with the foundational knowledge they need to start trading stocks.
Free PDF Guide : Get your Mastering Stock Market Language: An Introduction to Investment Terminology
Table of contents
- Buy
- Sell
- Bid
- Ask
- Spread
- Stock Symbol
- Annual Report
- Bull
- Bear
- Blue Chip Stocks
- Limit Order
- Market Order
- Volatility
- Averaging Down
- Capitalization
- Float
- IPO
- Secondary Offering
- Day Trading
- Broker
- Portfolio
- Index
- Margin
- Dividend
- Execution
- Sector
- Volume
- Yield
- Lastly on Stock Market Terminology
Buy
Investing in the stock market involves buying stock in a publicly listed company. Purchasing stock at a set price is an investment. Investors become shareholders by buying shares and may profit if the firm does well. If a company performs poorly, stock market investing can lead to financial losses. So, before buying stock in a company, rigorous investigation and analysis are necessary.
Sell
Selling stock to make a profit or reduce losses is prevalent in the stock market. Selling shares means giving up ownership of the company. If an investor sells shares at a higher price, they may profit. If the shares are sold at a lower price, the investor may lose money. Selling shares at a loss might reduce losses and free up funds for future investments. Selling shares should be based on investing goals and risk tolerance.
Bid
The bid price is the amount someone is willing to pay for stock. The bid price is significant when considering an investment. Buyers and sellers negotiate from the bid price, which is the most an investor is willing to pay for a stock. Market dynamics, stock demand, and investor mood can affect the bid price. Investors must set reasonable bid prices depending on their financial goals and market conditions. To make educated investment selections, investors may change their bid price to market conditions.
Ask
The ask price is the price at which stockholders will sell their shares to buyers. Sellers want the most for their shares, therefore this price is usually greater than the offer price. Buyers must decide if the requested price is worth investing in the company. If market circumstances are poor or the seller wants to sell quickly, the ask price may be negotiable. The ask price is usually non-negotiable, so purchasers must decide whether to accept or look elsewhere. Market developments, firm performance, and global economic conditions might affect the ask price. Since buying shares at the ask price is a big financial decision, investors should weigh all relevant factors.
Spread
The spread is a stock’s bid-ask disparity in trading. Investors pay it to purchase or sell firm shares. Brokers and other trade facilitators profit from the spread. Investors pay the spread to acquire and sell shares fast. The spread is usually a predetermined percentage of the trade’s value and varies per broker and stock. High-frequency traders and anyone who make many deals quickly should be mindful that the spread can affect their trades’ profitability. So, traders should carefully evaluate the spread and choose a broker with competitive pricing and transparent charge structures. Understanding the spread and its impact on trading expenses helps investors make better stock market selections and succeed.
Stock Symbol
Each publicly traded corporation has a ticker symbol, or stock symbol. This symbol reflects the company’s name and facilitates share trading. The stock symbol is commonly a combination of letters, numbers, and punctuation symbols to be easily remembered. Apple’s stock symbol is AAPL, while Microsoft’s is MSFT. Stock symbols let investors track company performance and make smart investments. Financial news outlets, trading platforms, and other market participants utilize stock symbols to share real-time market and stock information. Companies may rebrand or restructure, changing stock symbols. So, investors must monitor stock symbol changes to make informed judgments based on current information.
Annual Report
Publicly listed corporations must create and distribute annual reports to shareholders and other stakeholders. An annual report details a company’s finances, activities, strategies, and forecasts. The report covers the company’s income statement, balance sheet, cash flow statement, notes to the financial statements, management discussion and analysis (MD&A), and other information. Annual reports may cover corporate governance, CEO remuneration, environmental and social responsibility, and other non-financial measures that affect the company’s performance and future. The annual report can help investors decide whether to buy or sell firm shares. Investors can assess a company’s growth, hazards, and financial health by studying its financials and other data. Annual reports can also help analysts, regulators, and other market participants understand publicly traded companies and the economy. The annual report promotes corporate transparency and responsibility and informs stakeholders in the global financial system.
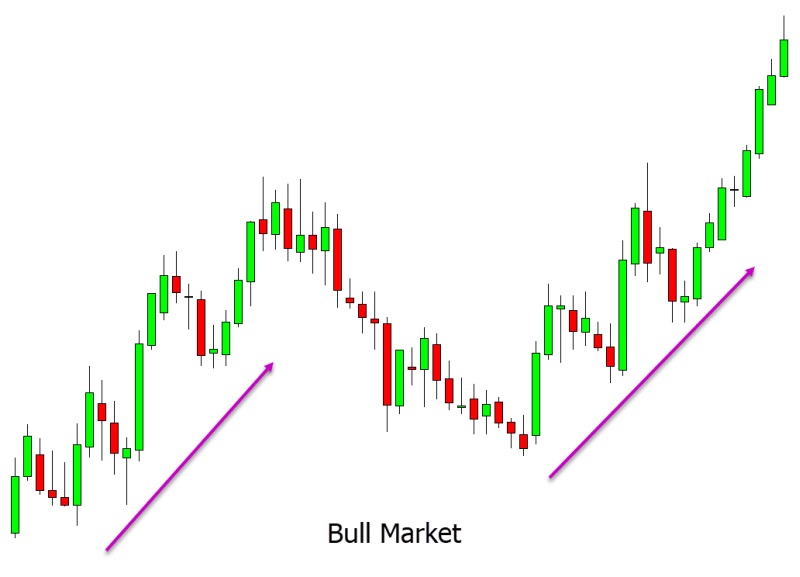
Bull
In finance, a bull is a bullish investor or market participant. Bulls expect prices to grow over time. Strong economic data, company earnings, and favorable monetary or fiscal policy can boost a bullish attitude. Bullish investors buy stocks, bonds, and other assets to profit from price increases.
Bullish markets have growing prices and investor optimism. In a bullish market, buyers pay more for assets. Low interest rates, good business earnings, and economic expansion can enhance demand. Investors may take greater risk in a bullish market because they are more confident in price direction. Bullish markets can boost the economy and offer investors high rewards. Bullish markets can increase volatility and risk, so investors should always do their research before investing.
Bear
Bears are investors or market participants that have a pessimistic view of an asset or the market. Bears expect prices to fall over time. Weak economic data, company results, or adverse monetary or fiscal policy might cause this gloomy feeling. Bearish investors often sell assets, short sell stocks, or take other actions to profit from market declines.
Bearish markets have dropping prices and investor pessimism. In a bearish market, sellers are eager to sell assets at lower prices. High interest rates, low corporate earnings, and low economic growth might reduce demand. Due to price uncertainty, investors may be more risk-averse in a negative market. Bearish markets can indicate economic weakness and make it hard for investors to make money. Bearish markets can allow smart investors to find undervalued assets and profit from clever investments.
Blue Chip Stocks
Blue-chip firms are industry leaders. These companies have strong financial performance, consistent profitability, and large market capitalization. Blue-chip stocks are well-known for their brand awareness, market share, and stability.
Blue-chip stocks are considered secure and reliable investments. These equities are more stable and resistant to economic downturns. Long-term investors benefit from blue-chip stocks’ high dividend yields.
Despite their steadiness, blue-chip stocks sometimes fluctuate. Economic and political developments can affect these companies, and market trends can affect their stock prices. Blue-chip corporations, as industry leaders, can weather market downturns and recover faster than other companies.
Individual and institutional investors seeking solid, long-term returns prefer blue-chip equities. Blue-chip stocks may offer stability, growth, and income to investors of all types, but no investment is risk-free.
Limit Order
A buy limit order is an order to buy a security below the market price. You want to enter the market at a bargain and think the security will rise in value.
Short-term price traders utilize buy limit orders. Traders might capitalize on market volatility by placing a purchase limit order.
Buy limit orders let traders set their entry price. Instead of buying at the current market price, traders can set their own entry price. This can help traders who think a stock is expensive and may fall soon.
Buy limit orders may not be executed. The order will be unfilled if the market price does not fall to the buy limit price. If the security’s price drops suddenly, traders may miss buying opportunities if their buy limit order isn’t filled soon.
Buy limit orders might help traders capitalize on short-term price swings. Nonetheless, traders should analyze their trading techniques before setting purchase limit orders due to their dangers and limits.
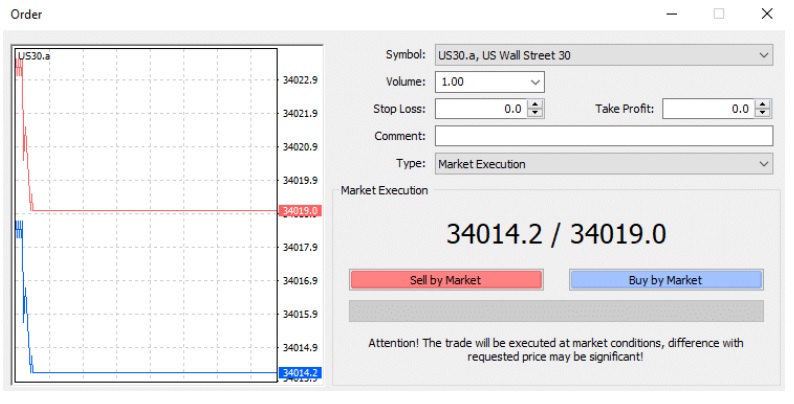
Market Order
Market orders instruct the broker to execute the trade at the best market price. Market orders execute immediately at the current market price, unlike limit orders, which set a price. Market orders are executed rapidly, allowing trading entry and exit. In volatile markets, market orders may be executed at a different price than the current market price. To reduce risk, traders should use limit or stop orders instead of market orders.
Volatility
A stock’s volatility is its price fluctuation. It simply measures price changes over time. A highly volatile market has huge and fast price fluctuations, while a less volatile market has slower price changes.
Investors and traders use volatility to make investment and risk management decisions. High volatility might offer immediate profits or losses based on price fluctuations. It can also make long-term holding riskier. Yet, low volatility may limit gains but provide more reliable and predictable returns.
Standard deviation, beta, and implied volatility quantify stock market volatility. These measures assist investors and traders evaluate a securities or market’s risk and uncertainty. Investors may make smart investments and reduce risk by knowing and monitoring volatility.
Averaging Down
Averaging down is a common stock market investment method that includes buying more shares as the price drops. This strategy lowers the portfolio’s average stock acquisition price. The investor buys additional shares at a cheaper price to lower the break-even point and increase profits when the price rises.
Assuming the stock price to recover, averaging down is risky. The stock may fall further, causing investor losses. Before averaging down, it’s crucial to evaluate the stock’s fundamentals and market conditions.
Capitalization
Capitalization, often known as market capitalization, is a company’s total stock worth. Multiplying the current share price by the total number of outstanding shares yields it. Capitalization is the stock market’s valuation of a corporation. Businesses with smaller capitalizations are riskier yet have more growth potential.
Float
Float is the number of publicly traded stock shares. Subtract the number of closely-held shares, such as those held by corporate executives, insiders, and other key stakeholders, from the total number of outstanding shares. The float shows the public’s share supply, which can affect the stock’s liquidity and price. A bigger float often increases liquidity and decreases stock price volatility, while a lesser float can increase price fluctuations.
IPO
A private company’s first public offering (IPO) lets investors buy shares. This is a major event for a firm and the stock market since investors are usually interested. Investment bankers help the company price and sell shares during an IPO. This process takes months and needs financial statements, prospectuses, and other legal paperwork. After the IPO, the public can buy and sell the company’s shares on the stock exchange.
Secondary Offering
A private company’s first public offering (IPO) lets investors buy shares. This is a major event for a firm and the stock market since investors are usually interested. Investment bankers help the company price and sell shares during an IPO. This process takes months and needs financial statements, prospectuses, and other legal paperwork. After the IPO, the public can buy and sell the company’s shares on the stock exchange.
Day Trading
Day traders enter and exit deals in one day to profit from short-term price changes. Day traders trade stocks, options, and futures in big volumes throughout the day. Day traders close all their trades by the end of the day, unlike swing traders or long-term investors.
Day trading needs knowledge, skill, and discipline to make quick judgments based on real-time market data. Chart patterns, market movements, and news releases help day traders find trading opportunities. Stop-loss orders and position sizing reduce losses and enhance gains.
Day trading is risky but lucrative for expert traders. Day trading’s quick pace can cause emotional trading and large losses. Market volatility, liquidity concerns, and technology malfunctions can affect day traders’ strategy and results. So, day trading requires practice, discipline, and risk management to succeed over time.
Broker
A registered stockbroker must perform your stock market trades. Licensed and regulated stockbrokers connect investors to the stock market. They offer market research, investment advice, and trade execution.
Stockbrokers are members of stock exchanges and have access to many financial products and investment opportunities. They buy and sell shares for clients and charge a fee. To ensure your assets are competently and in your best interest, hire a recognized and knowledgeable stockbroker.
Portfolio
Throughout time, you may buy many stocks or other financial assets. As you add investments, your portfolio grows. It includes equities, bonds, mutual funds, ETFs, and more. Diversifying across asset classes and businesses can reduce risk and boost long-term returns. Successful investing requires a broad portfolio customized to your investment goals and risk tolerance.
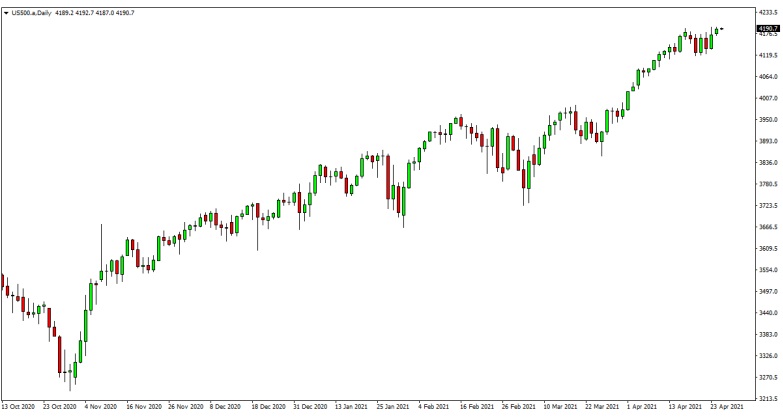
Index
Investors can track a collection of stocks using an index. It measures a sector’s or economy’s performance. The Dow Jones Industrial Average is a stock index comprising the 30 largest and most prominent US public corporations. Some global stock indexes reflect certain stocks or economic sectors.
Indexes show investors how a sector or market is doing. It also helps them compare stock performance to the market. Stock indexes can be traded via index funds, ETFs, futures contracts, and options contracts. Investors can diversify their portfolio without buying individual stocks by trading stock indexes.
Margin
Margin permits investors to borrow money from their broker to make larger market investments. You borrow money from the broker to acquire more shares on margin. This increases revenues but also hazards.
Margin enhances buying power but also market risk. If the market goes against you, your losses may increase. Know the dangers and use margin cautiously. Margin accounts also have minimum deposits and margin requirements that limit how much you may borrow based on your investments.
Dividend
A corporation pays shareholders a dividend. Businesses that continuously make big profits may issue dividends. Dividends might be cash or other assets. Investors seeking a steady income may prefer dividend-paying companies. The board of directors decides the dividend amount.
Execution
Execution in the stock market means buying or selling. Executing a stock order is it. Execution can also involve processing an order and transferring the goods to the buyer. For instance, when you buy a stock, your order is executed after the trade is completed. If you sell a stock, your order is executed when the sale is completed. Trading requires speed and accuracy, as delays or mistakes can cost money.
Sector
Sectors are groups of equities that represent a distinct segment of the economy in the stock market. Company industry determines stock sector. Technology companies develop and market tech products and services. Healthcare, energy, consumer products, financials, and utilities are also common. Sector analysis helps investors analyze market trends, dangers, and opportunities and choose stocks. Stock market analysis requires knowledge about sector performance.
Volume
“Volume” in the stock market refers to the number of shares traded in a day. Volume indicates market activity and liquidity and might reveal market movements and investor sentiment. Volume indicates market interest and activity. Low volume indicates market inactivity. Volume patterns help traders and investors understand market dynamics and make better trading decisions.
Yield
Yield refers to investment returns. It refers to an investor’s revenue or profit as a proportion of their investment. Yield is typically used to compute a stock’s annual dividend.
A stock’s yield is the company’s annual dividend payments divided by its price. A stock with a $100 price tag and a $4 annual dividend yields 4%. Bonds’ yearly interest payment as a proportion of their face value is yield.
Investors prefer investments with greater yields because they offer a bigger return. Companies may provide high dividends to entice investors despite poor financial health, which increases risk. So, when assessing investment yield, other elements including the company’s financial stability and growth prospects must be considered.
A Comprehensive Guide to Stock Market Terminology
Investors must understand stock market terminologies. This list is a solid starting point, however the stock market uses other less popular terminology. “Dead cat bounce” and “golden cross” are examples. But, understanding these terminology will help you navigate the stock market and make smart stock purchases and sales. Whether you’re a newbie or a seasoned investor, understanding stock market basics is crucial to trading success.