
The mismatch between supply and demand is what determines how much anything costs on the stock and forex markets. The order flow, which results from the influx and outflow of buyers and sellers competing at favorable prices, is represented by this discrepancy. Traders may be able to profit from these inconsistencies in the markets by having a thorough understanding of the order flow structure. In-depth discussion of the foundations of order flow trading and an explanation of simple price action trading strategies that can be employed in conjunction with it are provided in this article.
Table of Contents:
- Understanding Order Flow in Trading
- Integrating Order Flow into Your Trading Strategy
- The Correlation Between Order Flow and Price Action
- Analyzing Individual Candlesticks for Order Flow Insight
- Effective Order Flow Trading Techniques
- Executing Order Flow Breakout Trades
- Leveraging Order Flow Trading Indicators
Understanding Order Flow in Trading
In order to predict market moves, order flow trading entails examining the buying and selling activity of other traders, including major market participants. Although there are many ways to analyze order flow, including by employing indicators, this piece will concentrate on reading order flow through price action. This allows traders to locate high-probability transactions depending on where the main supply and demand levels are. While some brokers can tell you how many buyers and sellers there are at any particular time, this information cannot forecast the future market action. The ability of order flow analysis to anticipate price movements and support well-informed trading decisions is where its genuine worth lies.
Integrating Order Flow into Your Trading Strategy
Our goal when using price action and technical analysis for trading is to locate the market’s most advantageous entry points. Similar to this, in order flow trading, we look for order flow imbalances that we may profit from. This entails seeing the precise moments when the bulls or bears are going to grab power, allowing us to enter and make money.
Order flow analysis has a number of benefits, such as recognizing breakout and range trades, detecting big momentum shifts, projecting where the bulls or bears may be caught, and determining when momentum is waning and a reversal may be on the horizon.
The Correlation Between Order Flow and Price Action
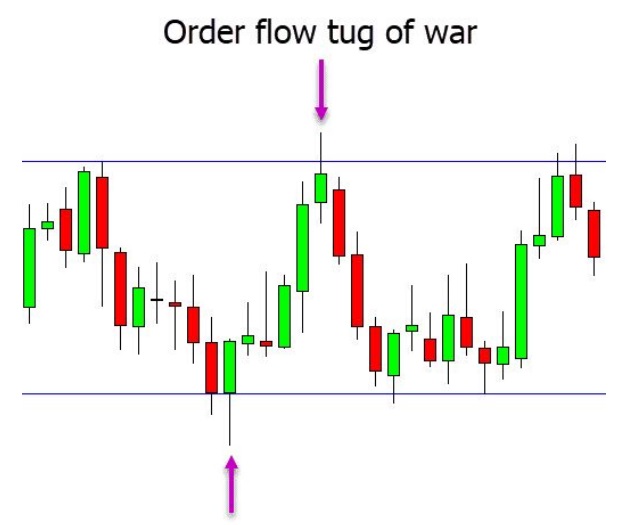
Price action is the most simple way to put order flow analysis into practice. We can learn about buyer and seller behavior by looking at raw pricing data. Have a look at the chart below, which shows a tug-of-war in the order flow.
The price goes sideways as it fluctuates within a range. But, the order flow quickly changes when the price crosses the range resistance and starts to rise. The price starts to decline as the bears seize power at this point. On the other hand, when the price reaches the range support, the mechanics of the order flow change once more, favoring the bulls over the bears and driving the price upward.
Analyzing Individual Candlesticks for Order Flow Insight
Order flow can be examined throughout a range of time frames, from the shortest to the longest. Also, you can examine it from the perspectives of a single candlestick and an entire price action chart. By carefully examining each individual candlestick, you can learn how to read and understand price action to understand order flow. Have a look at the example below, where the price results in an enclosing or outside bar.
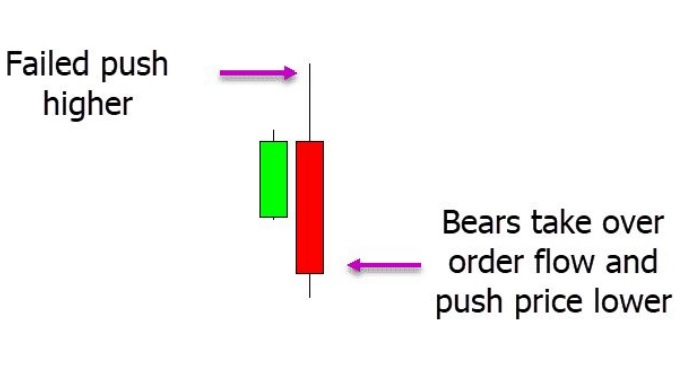
As the price opens and subsequently increases, this candlestick is created. The dynamics of order flow change as a result of the bears defeating the bulls. The engulfing bar is completed as the price falls and closes below the candlestick before it. The bears taking possession of the order flow in such a large way suggests that the dynamics have changed and they are now in charge.
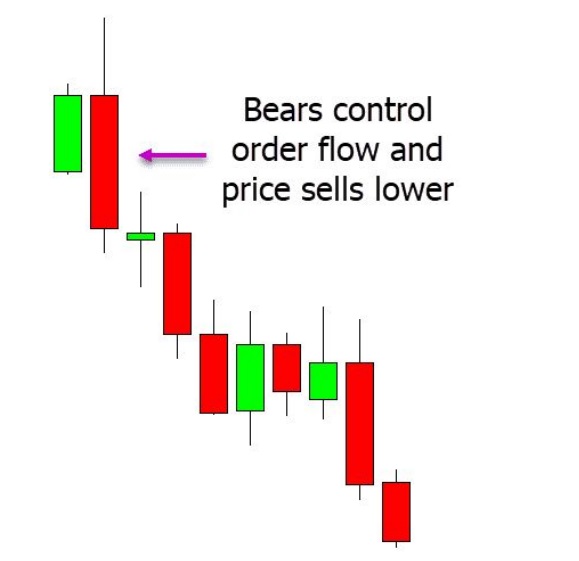
The same encompassing bar is seen in the second image below, but with a wider perspective. As we are well aware, the order flow changed, giving the bears the upper hand. The bears keep pushing the price lower once the price violates the law of the engulfing bar.
Effective Order Flow Trading Techniques
Your price action trading technique can find a number of viable trades by incorporating order flow analysis. As was previously said, this analysis may be used to pinpoint specific candlestick trades as well as range and breakout trades.
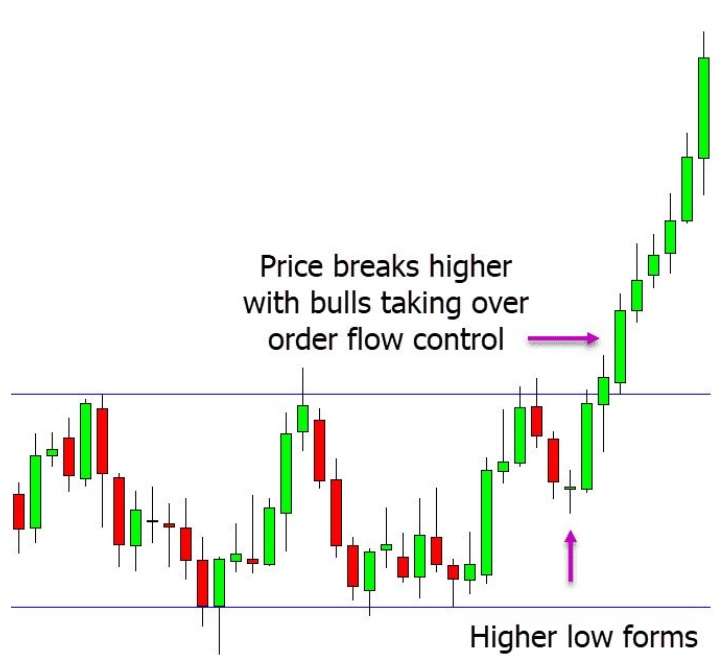
Executing Order Flow Breakout Trades
When the markets are tense and both buyers and sellers are at a standstill, breakout trades take place. One side will eventually seize control of the orderly process. A high probability breakout trade requires the occurrence of two events. Price should first repeatedly test the support or resistance level. Second, a lot of stop-loss orders need to be placed close to the breakout point. For instance, we can see that prices increased in the chart below. The first sign that the bulls are taking control is a higher low, which occurred because the bears were unable to get the price back down to the previous low. Many stop-loss orders are activated as soon as the price breaks through the resistance level, driving away the bears from the market. The price rises as a result of the bulls fully controlling the order flow.
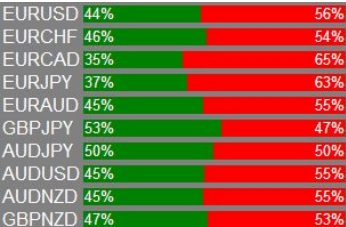
Leveraging Order Flow Trading Indicators
To analyze order flow, a variety of indicators are provided. The MT4 order flow indicator is a well-liked selection among them. This tool enables traders to quickly understand market sentiment by showing the percentage of buy and sell orders directly on Meta Trader charts.