
Andrew Technical analysts now have access to several powerful tools thanks to technology that can help them better analyze market trends and price swings. Indicators are now crucial for trading on the financial markets. Analysts almost never trade without them.
Indicators are mathematical formulas that analyze a security’s past price information and trading activity to forecast its future price. Technical analysts use this information to choose when to enter and exit trades.
The Andrews Pitchfork indicator is favored by traders. This technique was given its name by renowned technical analyst and financial specialist Dr. Alan H. Andrews.
The Andrews Pitchfork is a tool used in technical analysis to determine price support and resistance. For traders to forecast changes in the price of securities, three lines constitute a channel. The three lines are formed by three price chart points. usually the highest, lowest, and midpoint of a significant price swing.
The Andrews Pitchfork indicator aids traders in better understanding securities price movements and trading choices. The Andrews Pitchfork is important for traders on the financial markets because it can spot price channels and forecast price changes.
Free PDF Guide : Get your Mastering the Art of Trading with Andrews Pitchfork: A Step-by-Step Guide
Table of contents
- Introduction to the Andrews Pitchfork
- Drawing the Andrews Pitchfork: A Step-by-Step Guide
- Strategies for Trading with the Andrews Pitchfork
- How to Use the Andrews Pitchfork Indicator on MT4 and MT5
- Lastly
Introduction to the Andrews Pitchfork
A well-known technical indicator called the Andrews Pitchfork is used to locate key support and resistance lines in a security’s price chart as well as potential breakout and breakdown levels. The name of this indicator, which was developed by renowned technical analyst Alan Andrews, comes from the pattern it creates on a price chart, which roughly resembles a pitchfork. The image below shows an instance of the Andrews Pitchfork.
A central “median” line that passes through the Andrews Pitchfork’s center may be seen on the pricing chart above. This well-known technical indicator’s developer, Alan Andrews, found via rigorous research and observation that 80% of the time, a security’s price tends to move in the direction of the median line, with dramatic price swings making up the other 20%.
By using a fundamental trading strategy that entails placing long or short positions when the price swings away from the median line in the hope that it will eventually retrace towards it, traders frequently take use of this information. This method is frequently employed and has shown to be quite successful in locating probable entry and exit positions for trades.
It’s important to remember, though, that traders can improve their outcomes by using a more advanced technique when using the Andrews Pitchfork indicator. This strategy uses additional indicators to confirm prospective trading opportunities and a more in-depth investigation of the price chart.
Trading decisions can be improved by using these strategies since they help traders better comprehend market movements. Hence, in order to maximize their trading results, traders must be well-versed in the subtleties of the Andrews Pitchfork indicator and the different trading techniques that can be used.
Drawing the Andrews Pitchfork: A Step-by-Step Guide
Drawing Andrews Pitchfork on a price chart is a fairly easy operation that doesn’t require any special drawing software. The pattern is made up of three parallel lines that are formed by three crucial spots at the conclusion of an earlier trend. While the other two points are used to calculate the channel width, the first point is used to draw the median trend line.
Use these seven easy steps to depict Andrews Pitchfork on a price chart:
- Determine the trend’s beginning, which may be an uptrend or a decline. This idea will be known as Point 1.
- Decide which pivot points the response highs and lows of the uptrend or downtrend belong to. We’ll refer to these two ideas as Points 2 and 3.
- Use Point 1 as the starting point to draw the median trend line.
- The channel width is represented by the distance between Points 2 and 3.
- From Point 1 through the intersection of Points 2 and 3, draw a trend line that extends to the right of the chart.
- Parallel to the median trend line created in step 3, create and extend two more trend lines from Points 2 and 3.
- Point 1 can be moved around to change the pitchfork’s slope if necessary. Sometimes the established slope may not be realistic, and changing it can increase the Andrews Pitchfork’s accuracy. Very steep pitchforks are more likely to break, whilst too flat ones might not adequately represent the trend.
These easy procedures allow traders to draw the Andrews Pitchfork on a price chart and use it to analyze the patterns it generates to find potential trading opportunities.
Strategies for Trading with the Andrews Pitchfork
There are several trading strategies for using the Andrews’ Pitchfork indicator, but they are all based on the same fundamental principles. The first principle is that a security’s price tends to move around the median line. As such, the median line is a critical reference point for traders.
Secondly, when the price of a security deviates from the median line, it typically tends to revert to it. This is referred to as the 80% rule since there is an 80% probability that the price will return to the median line after breaking away from it.
The third principle is that when a security’s price breaks through the pitchfork’s range in the opposite direction of the prevailing trend, it can indicate a trend reversal.
One popular trading strategy for Andrews’ Pitchfork is to trade breakouts beyond the expected range. This strategy is based on the third principle and involves trading breakouts when the trend is about to reverse, as indicated by a bearish breakout during an uptrend.
If a trader observes a potential breakout, they should wait for confirmation by looking for the price to fall below the pitchfork indicator and then rise to test the resistance before falling back to its bottom. Once this occurs, the breakout has been confirmed, and the trader can enter their short positions.
It is crucial to set a stop-loss order at the resistance level that was tested before the price fell back to its bottom to mitigate the risk of substantial losses. Similarly, traders should set their profit target to be twice the amount of the potential loss. For instance, if a trader enters a $200 position and has a stop-loss order at $180, their take-profit order should be at $240.
By following these trading strategies, traders can use Andrews’ Pitchfork to identify support and resistance levels and find potential breakout and breakdown levels, allowing them to make informed decisions when trading securities.
How to Use the Andrews Pitchfork Indicator on MT4 and MT5
To apply the Andrews pitchfork indicator to your MT4 or MT5 charts, you can follow these simple steps:
- Open your MT4 or MT5 trading platform and select the chart you want to add the Andrews pitchfork indicator to.
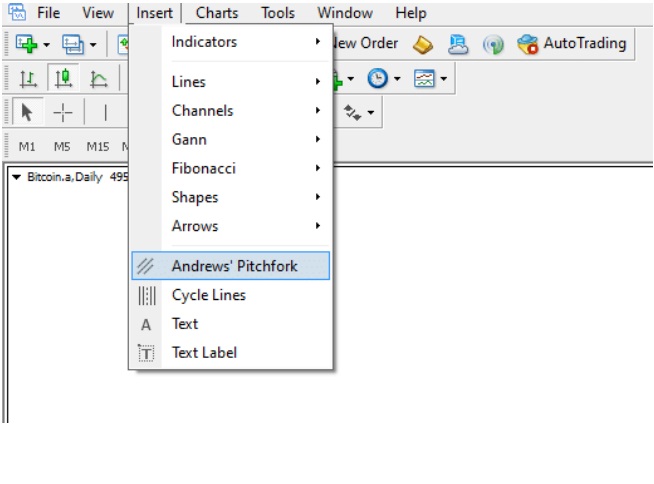
- From the top menu, click on the “Insert” tab and select “Andrews Pitchfork” from the drop-down menu.
- Click on the starting point of the trend, which will be point 1, and then drag the cursor to the second point, which will be the highest or lowest point of the trend.
- Release the cursor and drag it to the third point, which will be the retracement level of the trend.
- Once the three points are selected, the Andrews pitchfork will be drawn on your chart, indicating the potential support and resistance levels.
With the Andrews pitchfork indicator applied to your chart, you can now use it to help identify potential trading opportunities and make more informed trading decisions.
Andrews Pitchfork Indicator for MT4 and MT5
Lastly
Unfortunately, there is no reliable way for determining where to place the points for Andrews’ Pitchfork. Instead, traders must rely on their own discretion when setting up these channels. Like many other facets of technical analysis, success depends on a subjective element. This implies that prior to employing the indication in a real-world environment, it is crucial to gain experience by experimenting with it.
The success of the trading method depends on how the pitchfork’s three points are positioned. Hence, before taking a major financial risk, traders must possess the expertise and knowledge required to make these decisions accurately. It is crucial to keep in mind that even seasoned traders may have different ideas on where to set these points, emphasizing the tactic’s subjectivity.
Traders can develop the abilities needed to make wise selections about where to set pitchfork points by experimenting with the indicator and practice using it on a sample account. This tactic can assist lower the risk of making expensive errors while also increasing the trading strategy’s accuracy. Finally, mastering the knowledge and expertise necessary to use Andrews’ Pitchfork effectively is the key to success.