
Price charts are a visual representation of historical price information for securities that fluctuate over time. Patterns, the recognized shapes of price movements that constitute the basis of technical analysis, are seen on these charts. Analysts try to forecast future price movements based on human psychology and herd behavior by understanding these patterns. The ABCD pattern is one of the most significant patterns used by traders. This article will look at several ABCD patterns, offer tips on how to apply them when trading, and list a few helpful indicators to help you with your analysis.
Free PDF Guide : Get your Mastering the ABCD Pattern: A Trader’s Guide
Table of contents
- What is the ABCD Pattern?
- How to Use the ABCD Pattern
- XABCD Pattern
- Bullish ABCD Pattern
- Bearish ABCD Pattern
- Lastly
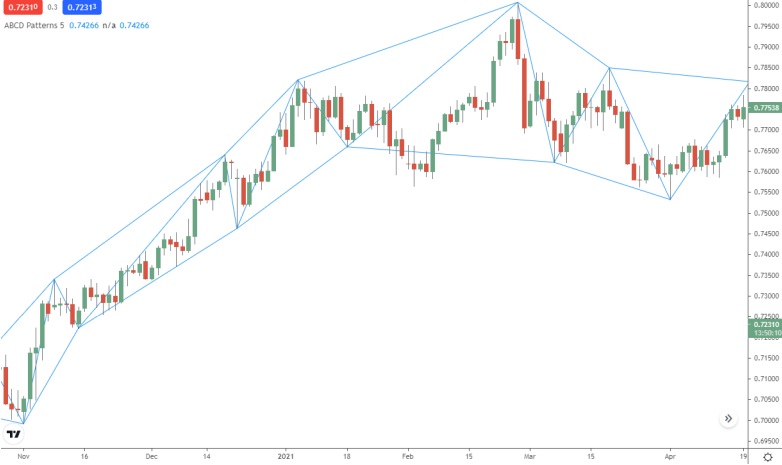
What is the ABCD Pattern?
One of the simplest price patterns to recognize is the ABCD pattern, which has four unique parts: A, B, C, and D. This pattern is used by traders to forecast when the price of an asset will shift and start to trend in the other direction. The ABCD pattern, for instance, can predict when an upward trend in a stock will change direction and begin going lower. The initial price movement is indicated by the A and B points, a retracement is indicated by the C point, and the price level at which the trend is most likely to reverse is indicated by the D point.
The ABCD pattern can be used with a variety of securities, including FX, equities, commodities, and futures, and is not restricted to any one time frame. When the BC leg is retracted after the AB leg and the CD leg has the same length as the AB leg, the pattern is generated. Point D will be above point B in a bearish pattern, whereas it will be below point B in a bullish pattern.
Market volatility can produce false signals, which can lead to an incomplete pattern formation, therefore traders must be careful. In these situations, it is crucial to wait for a pattern confirmation, which can be achieved by using other indicators like moving averages or oscillators.
In conclusion, the ABCD pattern is a well-known trading technique that can assist traders in spotting future price reversals in equities. Trading decisions can be made more intelligently and with greater probability of success in the markets by understanding the ABCD pattern recognition and applying extra indicators.
ABCD Pattern
How to Use the ABCD Pattern
Any trader in the financial markets can benefit from learning how to spot and trade the ABCD pattern. Knowing when a trend is likely to change allows you to take a position before the change occurs, increasing your potential gains.
Let’s explore the ABCD pattern’s trading strategy in more detail. Consider a situation in which you are seeking for an entry point to begin a short position on a stock that has been going higher. Finding the point (A) in a bearish ABCD pattern requires waiting for the price to rise to a new daily high at (B). A plunge back down to support at (C), which should be higher than the starting position, would then be anticipated after this (A). Prepare to enter a short position once support has been established at (C).
At that point, the price should begin to climb from its support at (C) to a new high at (D). The best time to start a short position is when the price hits (D), as the pattern is still valid and the trend should turn around at this point. After locating the entry point, it is crucial to decide when to close the deal.
Your exit aim should, in general, be twice as high as your risk. A take-profit order should be placed at $120, which is twice the amount you stand to lose, for example, if you enter a trade worth $100 and place a stop-loss order at $90.
On the other hand, you would approach the trade from the other side if you were trying to trade a bullish reversal on a stock that had been heading down. You would locate point (A) in a bullish reversal pattern and watch for the price to decline to a new low for the day at (B). You would then watch for the price to retrace to the resistance at (C), which should be lower than the starting position (A). When resistance at (C) has been established, get ready to open a long position.
After that, the price should begin to decline from its resistance at (C) to a new low at (D). The best time to start a long position is after the price hits (D), as the pattern is still valid and the trend should turn around at this point. Don’t forget to take your exit target into account when setting your stop-loss and take-profit orders. You may increase your trading success and advance as a trader by mastering the ABCD pattern.
XABCD Pattern
Similar to the classic ABCD pattern, the XABCD patterns are a class of trend reversal patterns. These patterns, which are composed of diverse measurements and ratios, are five-point chart patterns. Although there are several XABCD patterns, the Gartley, Butterfly, Crab, and Bat patterns are the most often utilized ones.
Based on how they are configured, each of these patterns can be bullish or bearish. Yet, due to their complexity, it can be trickier to find these patterns than the ABCD pattern. Fortunately, there are internet resources that can help with easier pattern recognition.
The ability to spot these XABCD patterns allows traders to foresee when the price of a security is about to shift direction, giving them a competitive edge. While technical analysis can be useful in predicting price changes, it is vital to keep in mind that it is not infallible, and traders should use it in conjunction with other types of analysis to make wise trading decisions.
Bullish ABCD Pattern
It is ironic that a sizable downward swing marks the start of the bullish ABCD pattern. A dramatic decrease in the security’s price due to increased selling pressure is followed by an increase in purchasers and a price recovery (B). The security price then declines to a support level that is below due to another spike in selling volume (A). This level of support can be defined as (C). The tendency should change following this final price decline, and the security price should start to rise (D).
Bearish ABCD Pattern
The bearish ABCD pattern begins with a rapid upward movement, just as the bullish ABCD pattern. The bearish pattern, in contrast to the bullish pattern, is defined by a drop in price following a peak at point (B). If investors take profits or short-sell the investment, selling pressure often drives this price down. The price then increases once again to point (C), but not quite to the level of the earlier peak. When buyers and sellers compete for dominance at this time, the market may exhibit some indecision, resulting in a period of consolidation. When the price finally reaches point (D), the uptrend has ended and a downturn has begun.
Lastly
It’s crucial for traders to realize that past performance does not guarantee future outcomes. Traders should take this adage seriously because it is commonly used in the financial community. Chart patterns can provide traders a statistical advantage, but it’s crucial to remember that they cannot ensure a trade will be profitable.
Price movements frequently veer away from prospective trading patterns, which is why this is. Making precise predictions can be difficult since the security price might react differently than the pattern might imply. For instance, a stock that previously displayed a bearish ABCD pattern might not always do so going forward.
Trading professionals should always keep in mind to effectively control their risk with stop-loss orders and sensible capital allocation in order to reduce this risk. In the event that the price of the securities moves in an unanticipated manner, stop-loss orders might help the trader reduce losses. On the other hand, effective capital allocation entails spreading out a trader’s capital among various securities, lowering the danger of suffering substantial losses from a single transaction.
It’s also crucial to remember that traders shouldn’t base all of their trading decisions exclusively on chart patterns. To validate a trading pattern, traders should employ additional technical analysis tools like oscillators and indicators. Also, traders should stay up to date on pertinent news and events that could affect the price of the securities.
Conclusion: Chart patterns do not ensure success in the financial markets, even though they can give traders useful information. The validity of a trading pattern should be verified using a variety of technical analysis tools, a cautious attitude to trading, and appropriate risk management. Trading professionals can use this to improve their chances of making money in the markets while lowering their danger of suffering big losses.