Trading channels provide traders with a practical method for locating important support and resistance levels as well as potential breakout chances. Trading within a price channel’s bounds as it forms while watching for bounces or breaks through the channel’s levels constitutes this strategy. In this article, we will examine the idea of channel trading and present some practical tactics for successfully putting it into practice.
Free PDF Guide : Get your Quick Guide to Channel Trading Strategies
Table of Contents
- What is Channel Trading?
- Channel Trading Strategies
- Ascending Channel Trading
- Descending Channel Trading
- Channel Breakout Strategy
- False Breakout Channel Trading
- Price Action Channel Indicators in MT4 & MT5
What is Channel Trading?
While trading channels, traders look for potential levels of support and resistance as well as breakout chances by drawing parallel lines connecting swing highs and swing lows. These lines are typically drawn by traders using trendlines. The resistance levels of the channel are represented by the trendline connecting the swing highs, and the support levels are provided by the trendline connecting the swing lows. Traders can spot bounce trades and potential breakouts by using these levels. The fact that channel trading can be used on a variety of timeframes and marketplaces, including Forex and stocks, makes it a highly favored technique in technical analysis. Channels can be used to identify support and resistance levels as well as potential breakout trades whether the price is moving up or down.
Channel Trading Strategies
Although there are many ways to trade channels, including the horizontal and break-and-retest techniques, there are four that are frequently employed:
- Ascending Channel Trading Strategy
- Descending Channel Strategy
- Channel Breakout Strategy
- False Breakout Channel Strategy
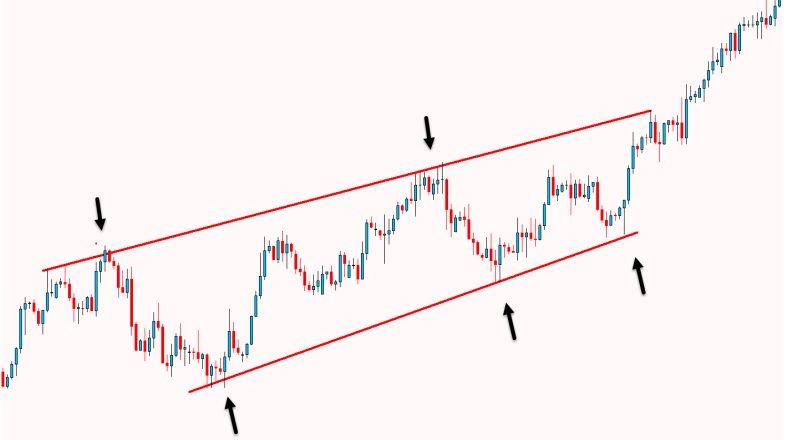
Ascending Channel Trading
When the price rises, higher highs and higher lows are generated, forming an ascending channel. Finding the upward trend and the channel is the first step in utilizing this type of channel. Following completion of that, traders can search for long and short trades based on their level of risk tolerance. Since trades with the trend have a better potential of success, traders should search for chances to enter long positions from the channel’s support when the price advances into the low. Yet, when the price enters the channel’s resistance and traders expect the price to bounce back lower, they may think about trading against the trend.
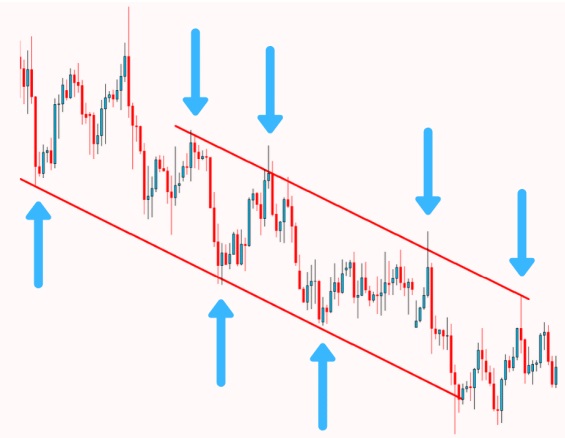
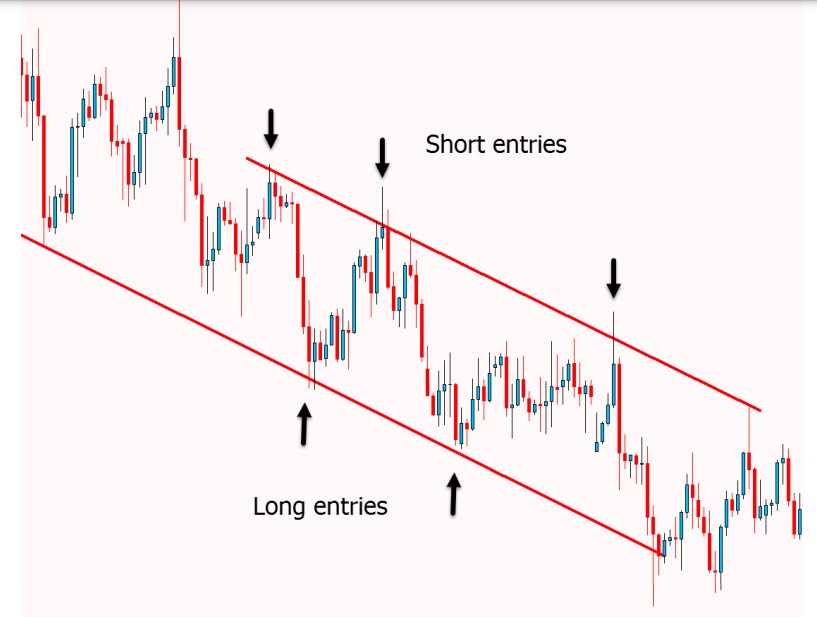
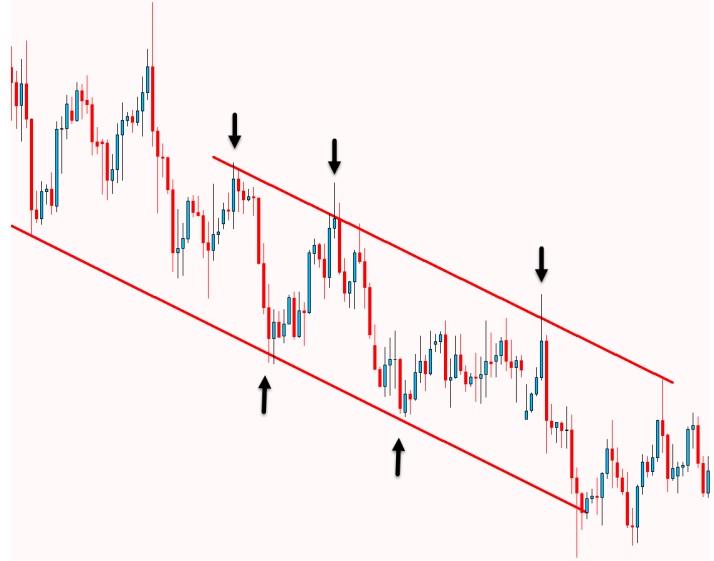
Descending Channel Trading
A downward moving price that produces a string of lower highs and lower lows is referred to as a falling channel. Trendlines can be used to connect these swing points and create the channel. Depending on your risk tolerance, there are two approaches to trading a descending channel. When the price approaches the channel’s resistance level, you can enter short positions if you prefer to trade with the trend. Even if this goes against the general downward trend, you can be more aggressive and search for long bullish trades when the price reaches the channel’s support level.
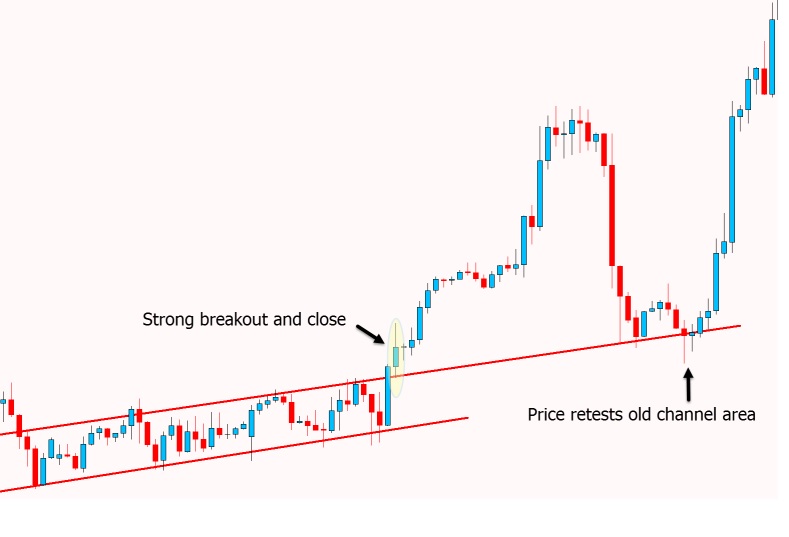
Channel Breakout Strategy
Traders frequently employ the channel breakout method. It entails keeping an eye out for channel breaks and making the most of any potential strong momentum. The price first remains within the ascending channel, as shown in the example below, before eventually suffering a strong breakout to the upside.
A crucial closing above the top trendline zone is also recorded by the price. When the price retraces after the breakout, the previous channel level acts as a new support level. It is important to keep in mind that the breakout will probably be stronger the longer the channel holds.
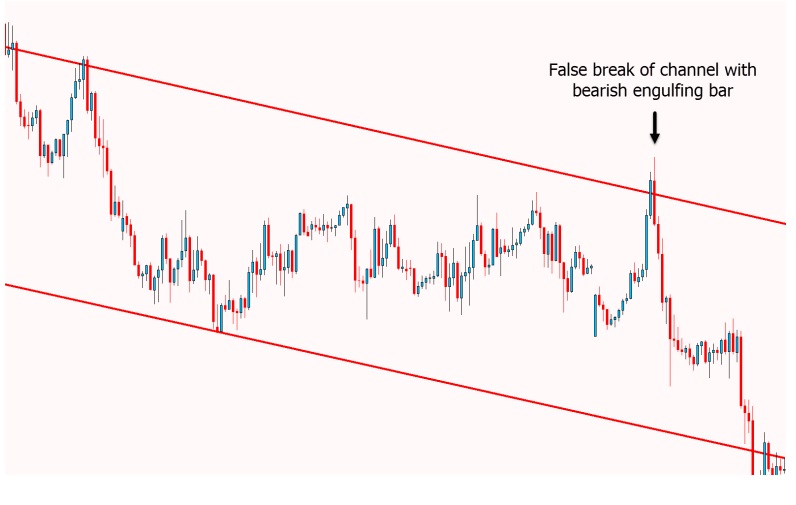
False Breakout Channel Trading
False breakouts, where the price briefly breaks above or below the channel’s support or resistance level before coming around and returning to the channel, are common in channels. Fake break traders may profit from these circumstances. This scenario is demonstrated in the example below, in which the price was in a downward channel and briefly tested the resistance level. It rapidly reversed course, generating a bearish engulfing candlestick pattern that hinted at potential price declines. Traders can also use Japanese candlesticks to look for possible channel trade entries.
Price Action Channel Indicators in MT4 & MT5
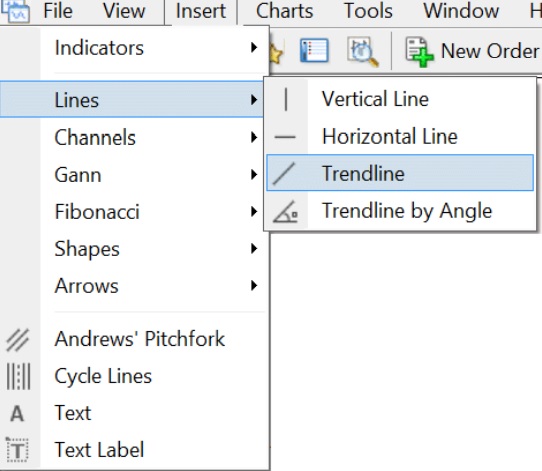
It’s easy to create a channel in your MT4 or MT5 charts. Just carry out these actions.
- Activate the MT4 or MT5 charts.
- After clicking “Insert,” choose “Indicators,” then “Lines,” and “Trendlines.”
- To mark your trendline, click the initial high or low point, drag it to the desired location on the chart, and then release the mouse button.
- To build the second section of the channel, repeat the previous action.