Finding trading patterns takes up a sizable part of your day when you trade the markets. Over time, you will improve at spotting patterns, but initially, you will need to put a lot of time and effort into doing so in order to start and finish places. Your chosen pattern category and trader type will influence the patterns you choose to trade. Whatever the case, you should be knowledgeable about different trading trends. This article seeks to inform you about the definition of trading patterns, the different types of patterns that can be used, and examples of each type of pattern.
Free PDF Guide : Get your Understanding Trading Patterns: An In-Depth Guide
Table of Contents
- Introduction: Trading Patterns Explained
- Understanding Candlestick Charts
- Patterns for Long-Term Trading
- Patterns for Intraday Trading
- Patterns for Swing Trading
- Patterns for Trend Trading
- Patterns for Stock Trading
- Profitable Trading Patterns
- Trading with Classic Chart Patterns
- Lastly
Introduction: Trading Patterns Explained
It is essential to comprehend what patterns are and why they are significant for traders in order to identify and select from the various trading patterns that are accessible with accuracy. A pattern is a distinctive formation brought on by price changes in a particular asset or stock. In order to predict a stock’s future price direction, a trader must find patterns in a stock’s highs, lows, or closing values.
The ability to detect trading patterns in real-time is essential for successful trading, even though it’s simple to spot them retrospectively by examining previous price movements. All technical research is based on the real-time detection of patterns, which can be done whenever, with any security. Traders can keep an eye out for a variety of patterns, each with a different level of predictive power, depending on their trading strategy, risk tolerance, and instruments traded. The likelihood of making money using that method to trade increases with predictability.
When forming and recognizing trading patterns, candlestick patterns—which we’ll talk about below—are usually used.

Understanding Candlestick Charts
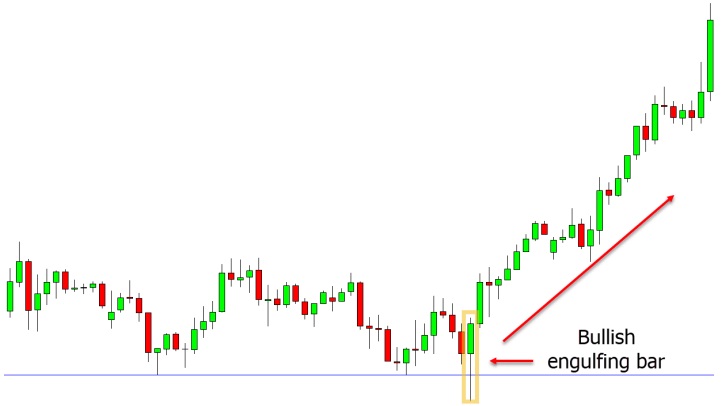
Because of its readability and capacity to offer useful information for spotting patterns, the candlestick is a chart type that is frequently used by traders. Each candle on a candlestick chart indicates a unit of time, and traders can select the length of a single candle according to their preferences, from one second to one day. Various patterns in stock price data can be revealed over different time periods, which can lead to various strategies.
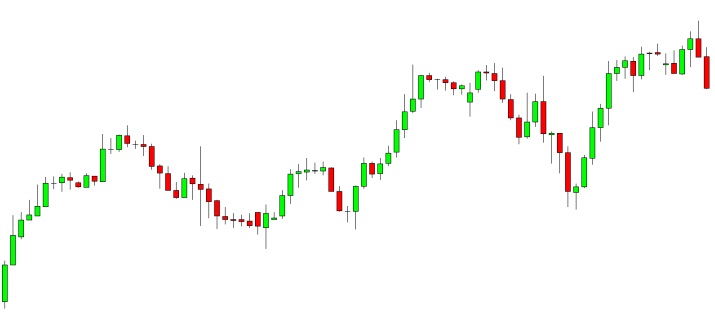

It is simple to read a candle by understanding its two components, the body and the flames. The wicks above and below the body represent the highs and lows of the trading time, respectively, while the body links the opening and closing prices. Candles represent market sentiment in addition to providing price information. A market is said to be bullish when the flame is green, and bearish when the candle is red. As a result, candle analysis can be used to determine market mood.
One, two, or more candles may be used to create candlestick patterns, with each candle representing a distinct movement in stock prices. Trading success requires an understanding of the psychology underlying these patterns and emotions. Below, various trading patterns are described and are broken down into types.
Patterns for Long-Term Trading
Trading patterns can be grouped according to their timeframe, which could be the timeframe for position payoff or the timeframe for analyzing market movements. extended-term traders benefit from extended time horizons, high levels of patience and discipline, and long-term trading patterns. The cup and handle pattern and the head and shoulders pattern are two frequently used long-term trading designs.
The cup and handle pattern develops over a time frame of 7 to 65 weeks and is a bullish indicator. This pattern’s illustration shows a cup with a handle. When the handle ends and the price begins to rise, the trading strategy calls for entering a transaction at the resistance level. To guard against a retreat, a stop order is put in place. The pattern, however, may take any amount of time to play out, creating uncertainty and the possibility of missing the indication.
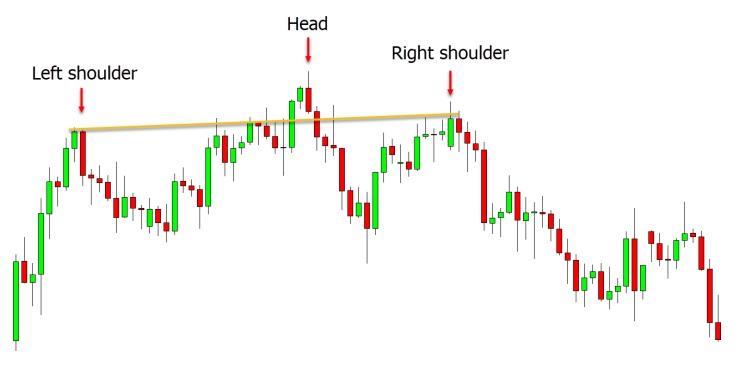

A trend reversal can be widely predicted over the long run using the head and shoulders pattern. The stock price has three peaks on the chart, with the second peak being the head of the body and being much higher than the other two. This pattern can be seen over a span of a few weeks and has a shorter time frame than the cup and handle pattern. At the third peak, traders can short the market because it denotes a bull-to-bear reversal. Even though it limits their potential gains, risk-averse traders prefer to wait for the price to hit support levels before starting a short position to reduce downside risk.
Patterns for Intraday Trading
Because trades are started and closed within a single day, intraday chart patterns have a shorter time frame than long-term chart patterns. These strategies are frequently employed by day traders, and effective execution necessitates keen observation, quick reflexes, and analytical abilities. The shooting star and the Doji candlestick are two intraday chart formations that are frequently used.
The shooting star candlestick signifies a change in direction from bullish to bearish. It has a short body and an upper shadow that is at least twice as long as the body, appearing at the conclusion of a bullish trend. As long as there is secondary confirmation, the presence of the shooting star pattern is a reliable indication to initiate a short position.
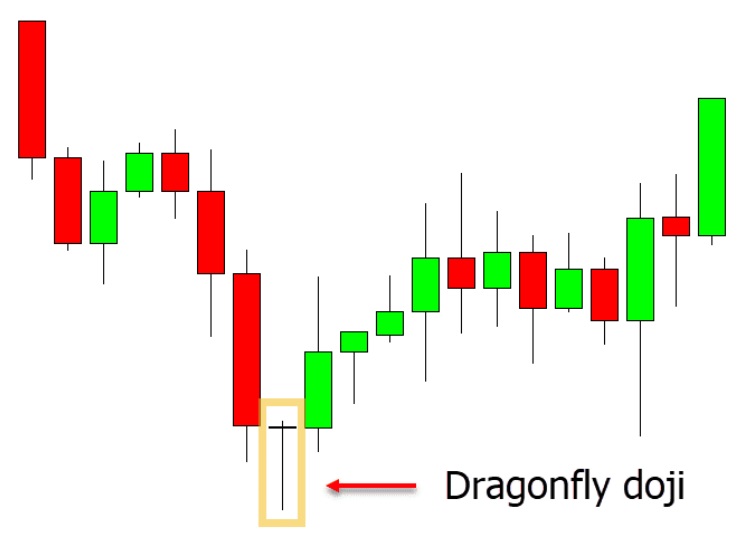
The Doji candlestick pattern denotes uncertainty and a possible reversal of the direction. The minuscule body and lengthy shadows give it the appearance of a cross. Depending on the preceding candlesticks, the turnaround may be bullish or bearish. It suggests a potential downtrend if it is seen at the peak of a bullish trend, and the beginning of an uptrend if it is seen at the bottom of a bearish trend. A Doji candlestick is a reliable sign that it’s time to start trading against the prevailing direction.

Patterns for Swing Trading
Swing traders capitalize on price fluctuations in assets over a period of time that ranges from a few weeks to a few months. To recognize and anticipate possible swings, they need discipline and analytical abilities. The T-30 pattern and Bull Flag pattern are two of the most used chart patterns by swing traders.
The T-30 pattern is simple to spot and is characterized by a candle that crosses through the 30-day average price levels with more volume than the prior days. When this pattern is seen, traders purchase the stock because it signals a turn away from a bearish trend.
The bull flag pattern, which looks like a flag, denotes a reversal in the direction of the stock price. It has three key characteristics: a price movement with high volume moving upward, stabilization at the peak, and a slow downward movement before turning around and moving upward with higher volume. Scanners are frequently used by traders to recognize Bull Flag formations in real-time.
Patterns for Trend Trading
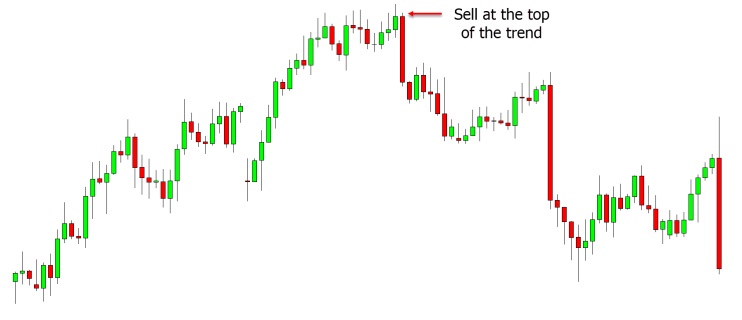
Reversals and continuations are the two groups into which trend trading patterns fall. Regardless of the timeframe, trend traders try to trade the underlying direction of a stock. In order to take a position against the market’s present momentum, reversal traders look for signs that a trend is about to reverse. In order to recognize overbought and oversold situations, they employ indicators like the RSI. Contrarily, continuation traders take a position in the same direction as the current momentum in an effort to benefit from the trend and ride it.
They think the pattern will last for an extended time. To find the potential point of a breakout, where the stock price will overcome the resistance levels and resume its upward trajectory, they instead use patterns like triangles. Even though continuation trades are thought to be safer, their potential for profit is constrained because a reversal could occur at any moment.

Patterns for Stock Trading
As was previously mentioned, various traders use particular patterns to carry out their transactions. Every pattern communicates a different story about the stock price and its potential future movements. knowledge stock patterns requires a knowledge of the psychology underlying the market segments, such as bulls and bears. Each candlestick must be examined in order to ascertain its significance and what it might portend for upcoming market movements. A trader can find chances to execute profitable trades by analyzing each pattern.
Profitable Trading Patterns
Scanners are used by traders to spot patterns that might be challenging to notice in real time. Scanners come in two flavors: automated and optional.
Discretionary scanners warn traders about particular market patterns, but the dealer ultimately decides whether to act on the pattern. With more control over their trades thanks to this method, traders can concentrate on high-probability trading methods. But it might also lead to lost chances and less lucrative trades.
On the other hand, automatic scanners spot a pattern and start a position automatically if it meets the trader’s predetermined requirements. This can lead to sub-optimal trades if the scanner’s criteria are not clearly specified, but it is useful for paper trading and trying trading strategies in real-time.
In the end, traders must balance the benefits and drawbacks of each form of scanner to determine which one best suits their trading style and objectives.
Trading with Classic Chart Patterns
It is significant to remember that not all trading patterns are lucrative, and traders must choose those that have the best chance of succeeding. This necessitates examining the commerce for confluence and open areas.
The term “confluence” describes the quantity of indicators that back a specific trading chance. A trade has a better chance of success if several indicators, such as support and resistance levels, a doji candlestick pattern, and a favorable RSI reading, concur on it.
Wide-open space, on the other hand, describes the possible range in which the price of a stock can go after a position is initiated. The potential for success increases with the size of the wide-open area, which is frequently expressed as the distance to the next level of support or resistance because these are the areas where reversals are most likely to occur.
Confluence and open space are two factors that traders should take into account when looking for high-probability and lucrative trading chances.
Lastly
You have learned about several trading strategies in this piece, each of which has distinct qualities like difficulty, timeliness, degree of certainty, and potential for profit. But as a trader, you still need to become acquainted with a ton of other patterns that are available. To increase your trading profitability, you should think about your personal trading approach as you read about and learn about these patterns, practice spotting them in real-time, and create a plan to capitalize on them.

