The tools available to effectively use technical analysis have developed significantly with the advancements in technology. Mots, if not all, of the technical analysts trading today rely on indicators to assist with their trading.
Indicators are tools that use statistical and mathematical calculations that are designed to provide insight into future price movements of a security.
Indicators use a variety of metrics. Some of the most common indicators use such data as trading volume and historical price data. This information provides technical analysts with specific information that they use as part of their trading choices.
Thissection will discuss one of these indicators known as the Andrews Pitchfork indicator.
What is the Andrews Pitchfork?
The Andrews’ Pitchfork is a technical indicator developed by Alan Andrews. It is used to identify support and resistance levels and it highlights potential breakout and breakdown levels.
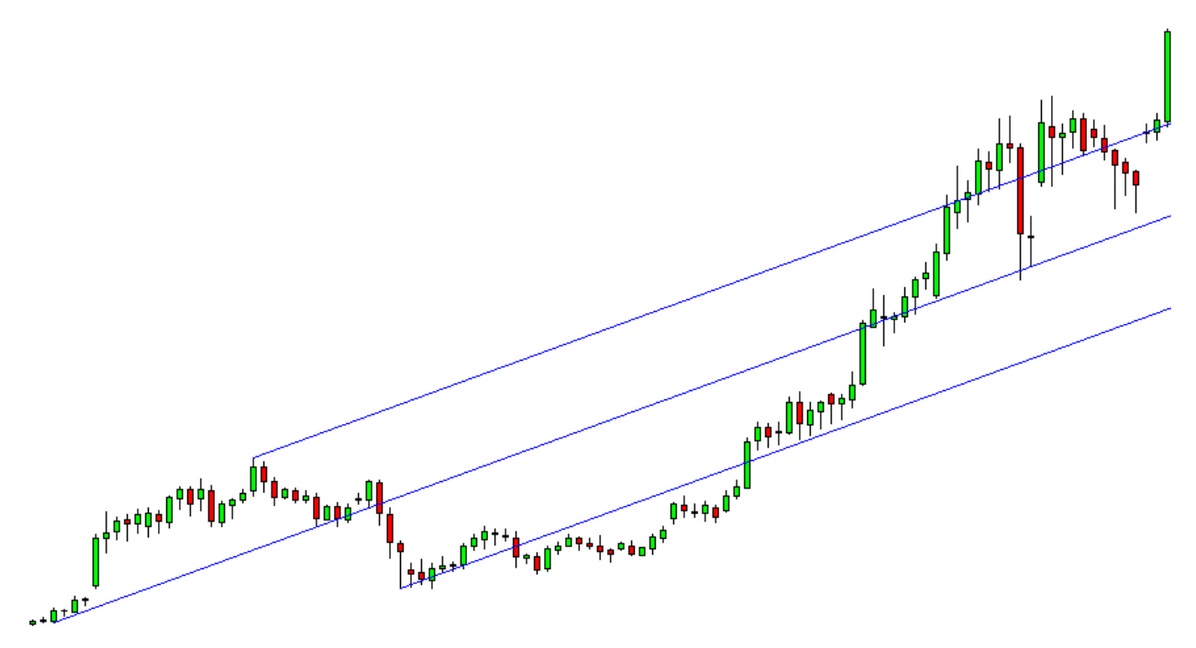
The Andrews’ Pitchfork pattern is shown .
Looking at the chart above, you see a central median line running between the upper and lower lines of the “pitchfork”.
Alan Andrews determined that the price of a security will gravitate toward the median line 80% of the time, but that the other 20% would likely be large price fluctuations.
Trading with the pitchfork indicator requires focus on the price fluctuations. Expecting to see a gravitation to the median line guides you toward long or short entities when the price is moving away from the line.
This explanation should give you the basic idea, but we will go more in depth throughout this discussion.
How to Draw an Andrews Pitchfork
Drawing an Andrews Pitchfork is rather straightforward, and is easily achieved. The pattern uses three parallel lines. These lines are created using three points at the end of a previous trend. The pattern is drawn by connecting the first point with the midpoint of the other two points.
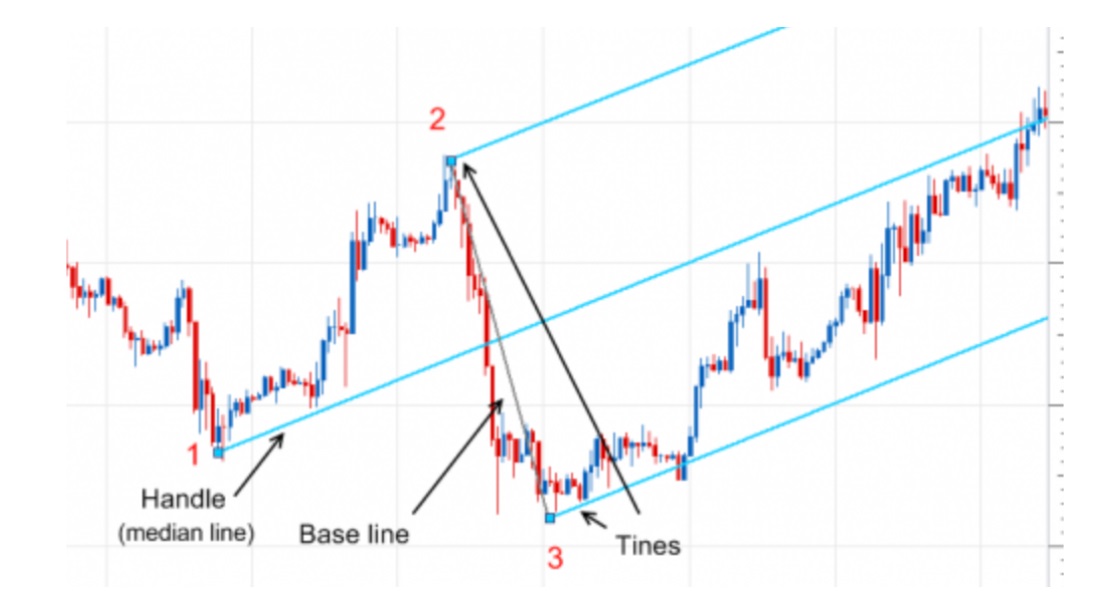
Andrews Pitchforks can be drawn by following these simple steps followed by an illustration:
- Identify the beginning of a trend. The trend can either be an uptrend or a downtrend. This will be point 1.
- Points two and three will be drawn at the pivot points (the reaction highs and lows of the uptrend/downtrend).
- Point 1 will be your starting point for the median trend line. It is midway between points 2 and 3.
- The distance between points 2 and 3 represent the width of the channel.
- Draw and extend a trend line from point 1 through the midpoint of points 2 and 3.
- Draw the trend lines from points 2 and 3, keeping them parallel with each other and the median trend line drawn in step 3.
How to Trade the Andrews Pitchfork
The Andrews Pitchfork uses three basic principles.
- Prices typically move around the median line. The idea is that when prices begin to trend away from this line, they will reverse and gravitate back to it.
- Using the 80% rule, when the price breaks away from the median line there is a very good chance it will come back to the median line.
- If the price of the security breaks through the range of the pitchfork, be on alert for a potential reversal in the trend.
One of the most popular strategies used with the Andrews Pitfork is focused on the 3rd principle. It involves trading breakouts outside the expected range. Let’s look at this principle in more detail. Consider a situation where the uptrend is about to reverse after a bearish breakout.
Example: We see a price chart and notice a potential breakout. Ove detected, wait for the breakout to be confirmed. This confirmation happens when the price falls below the pitchfork indicator and creates a bottom before rising again to the bottom of the pitchfork where it will test the resistance.
After the resistance has been tested, if the price then falls back below this bottom, the breakout has been confirmed. It is here where you would begin to enter short positions.
Keep in mind that confirmation of this pattern must occur. Always look for the entry point and calculate your risk by using a stop loss. In this trade, you should set the stop-loss at the resistance level that was just tested before the price fell back to its bottom.
Like with other trading strategies, know your risk reward level. Many traders use a 1:2 reward to risk when using the Andrews Pitchfork but it is your personal comfort level that should be your guide.
Andrews Pitchfork Indicator for MT4 and MT5
If you do not have the best MT4 / MT5 charts to use these indicators, you learn how to get the best free trading charts and the best brokers to use these indicators right here.
The Andrews pitchfork indicator is built into your MT4 and MT5 charts with no additional downloading required!
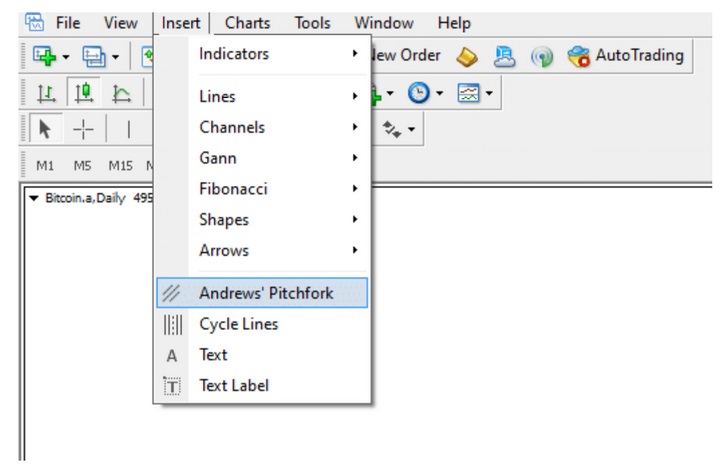
To use the Andrews pitchfork on your Metatrader charts, follow these steps:
- Open your MT4 or MT5 charts.
- Click on ‘insert’ and then click “Andrews pitchfork”. (see below)
- Then you can select the points on your chart where you want to place the indicator.
If you are having trouble with this installation and/or using these indicators, read “How to Download, Install and Use MT4 and MT5 Indicators”.
Conclusion
Andrews’ Pitchfork is an effective indicator, but it is somewhat subjective in that traders sometimes need to use their own judgment when placing these channels.
Through practice, like with most most aspects of technical analysis, traders will gain confidence in where these channels should be placed. It is beneficial to practice without risking money when using any indicator that has some subjectivity. It will help you succeed.
While the Andrews Pitchfork is rather straighthforward, it is only successful when traders accurately place the pitchfork points and trend lines.
Related Projects

Fundamental Analysis In Forex
Accounting / Financial
ABCD Pattern
Accounting / Financial
Forex Math
Accounting / Financial